
Total Cost of Ownership (TCO) #

In This Section #
- Introduction
- FOScore TCO Data Structure
- Level 1
- Level 2
- Data Sources
- Assets Module
- TCO-Related Client Settings
- TCO Module Defaults
- TCO Building Type Defaults
- Portfolio/Site/Building Type Defaults
- Asset Specific
- Search
- Visual
- Escalation
- Total Cost by Group
- Level 1
- Level 2
- Total Costs Per Year
- Data Grid
- Data Grid Features
- Create Filter
- Select a Display Format
- Export
- Data Grid Features
- Client-Level Map
Introduction #
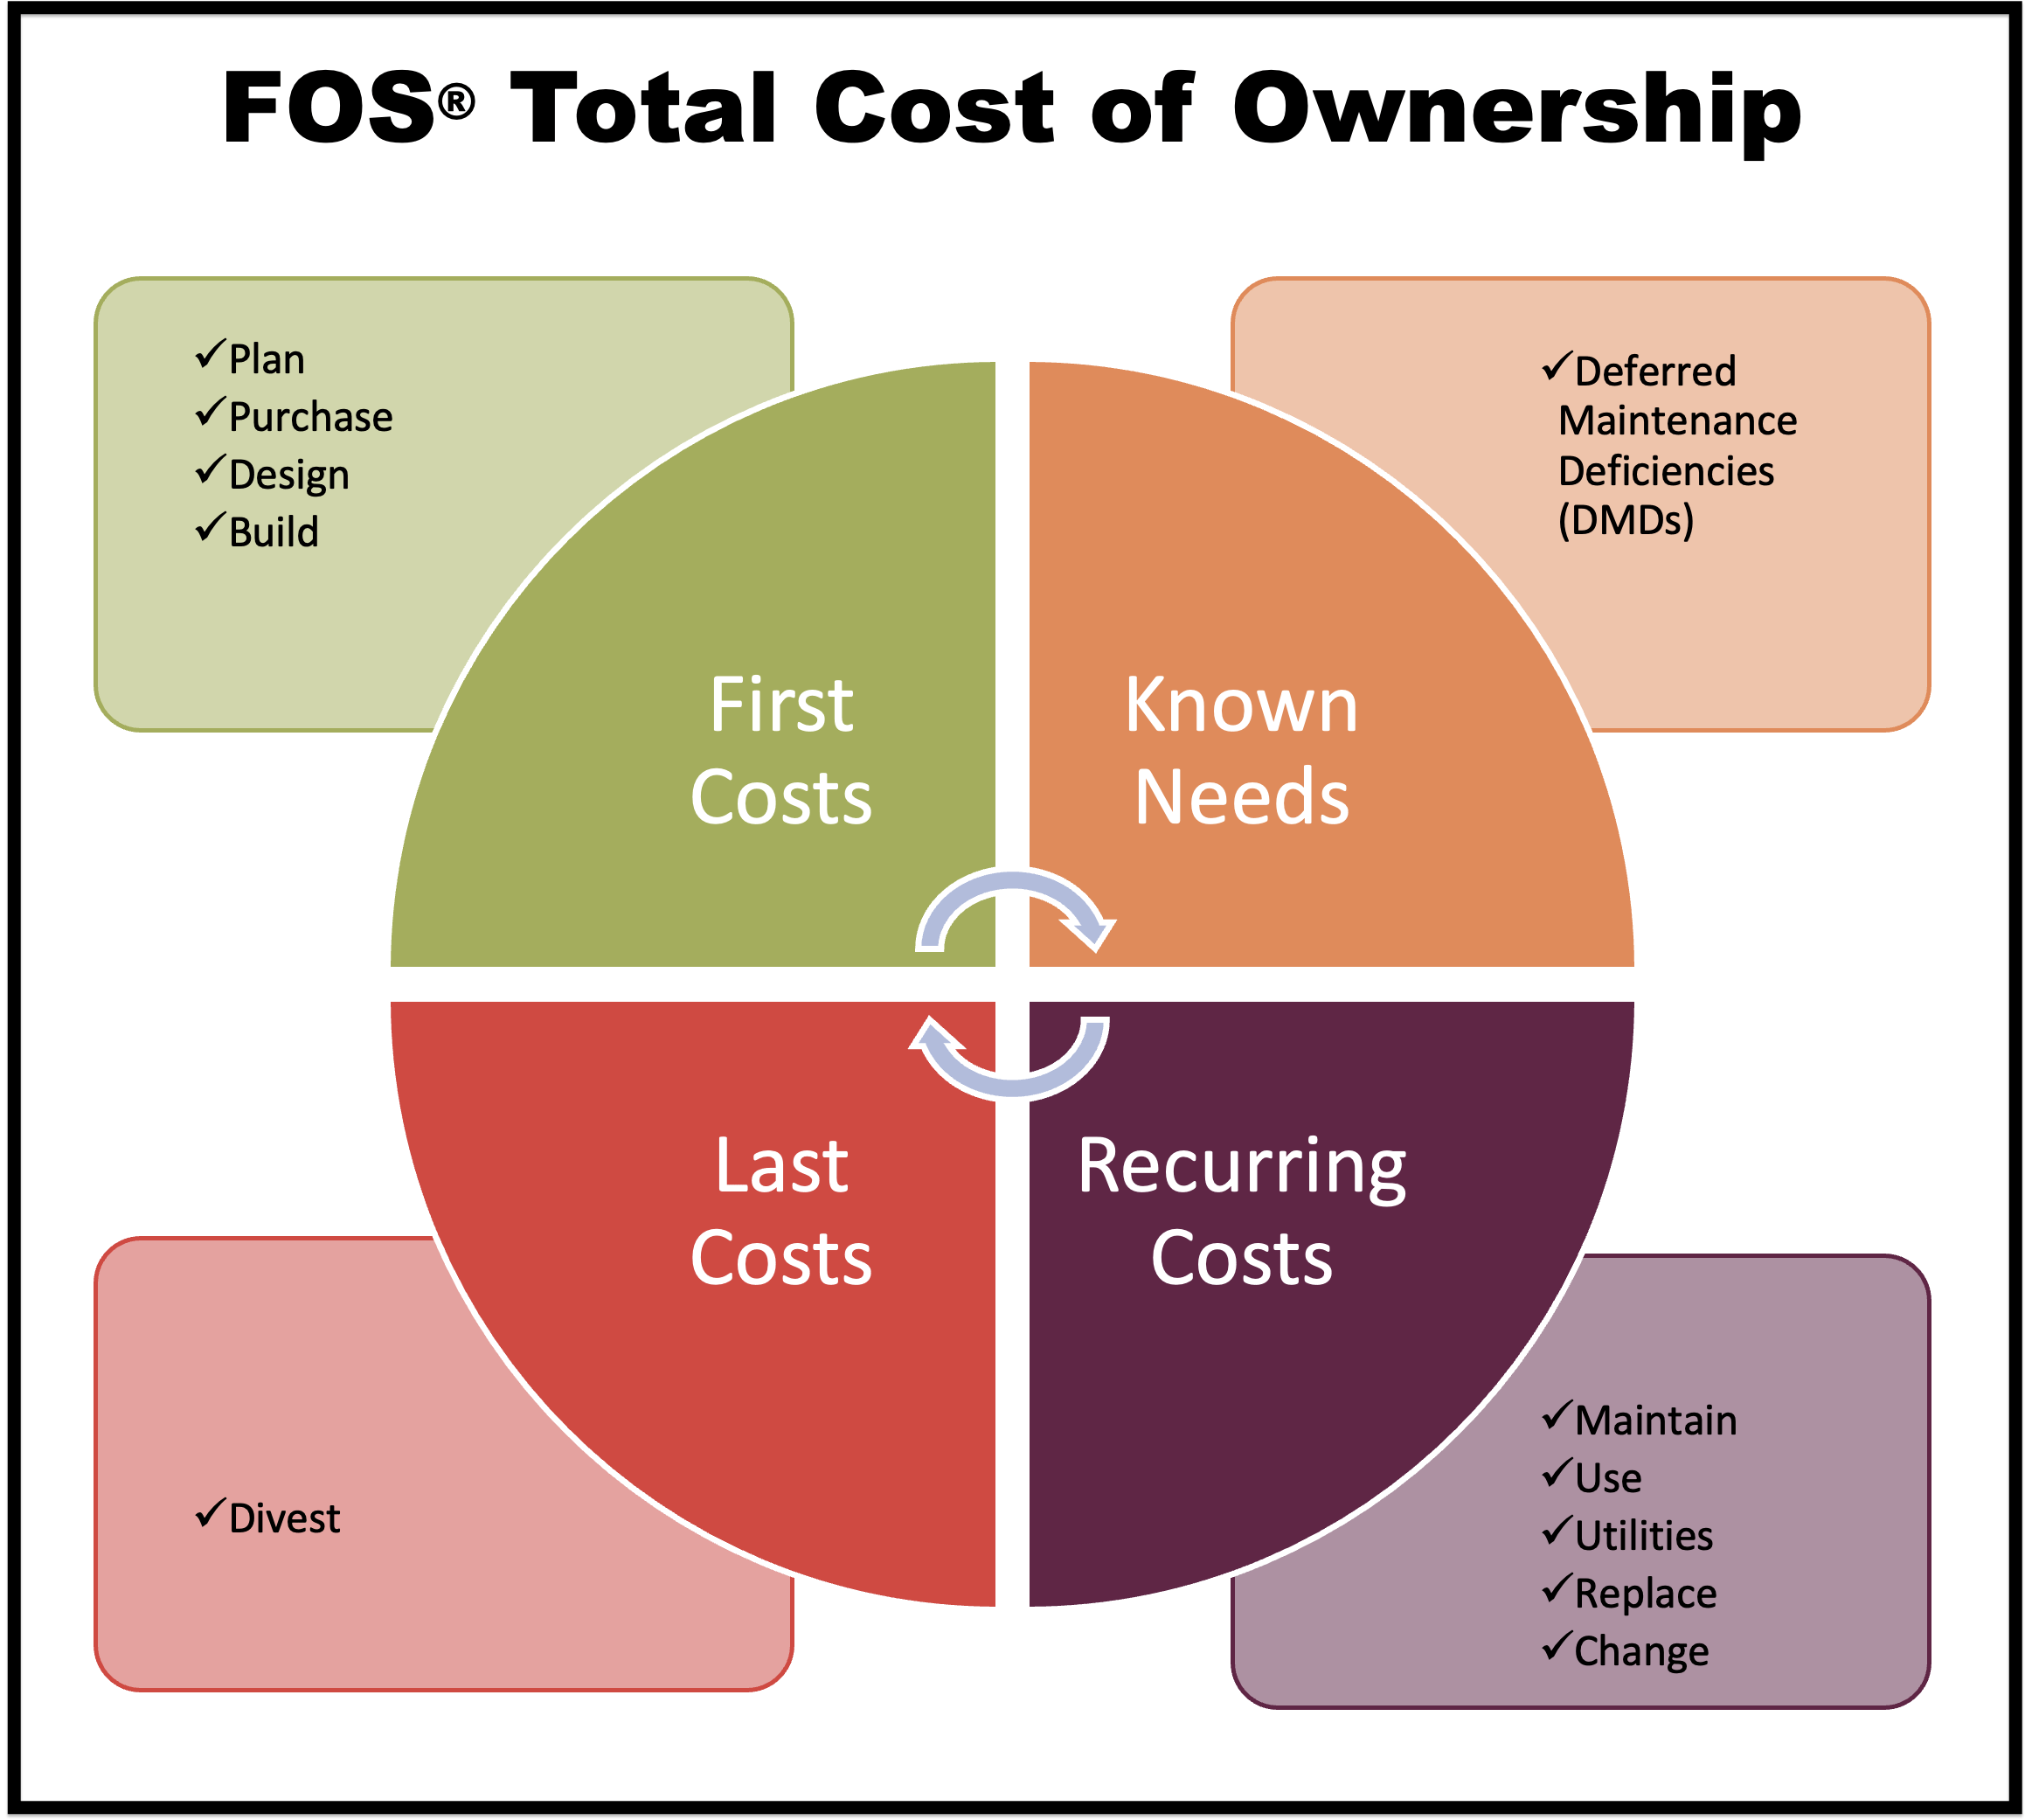
The FOScore® TCO Module provides facility management teams with the ability to understand and communicate the total cost of ownership of assets in an organized manner. This includes First Costs, Known Needs, Recurring Costs, and Last Costs.
First Costs and Known Needs are gathered from the FOScore® Assets Module. Default values can be set at the Module and Portfolio/Site/Building Type levels. Asset-specific values can be entered for one-time or yearly recurring costs. This is a tiered structure–if no asset-specific values exist, Portfolio/Site/Building Type defaults are used; if no Portfolio/Site/Building Type defaults exist, Module defaults are used.
The TCO Module is powerful yet flexible.
- FOS TCO Levels 1 and 2 can be mapped to a client-specific structure that can be referenced in the Ad Hoc Reporting tab of the Reports Module.
- You determine what level of detail is appropriate for your team to get the best return on investment in your data collection and analysis.
- In addition to an interactive data grid that can be exported, visuals provide an overview of the Total Cost of Ownership.
Please note that TCO data is rebuilt nightly due to processing times.
FOScore® TCO Data Structure #
Within the FOScore® system, a simplified data structure has been created that correlates to industry standards. The data is gathered in two levels:
Level 1 #
Level One is broken down into First Costs, Known Needs, Recurring Costs, and Last Costs.
Level 2 #
Level 2 further breaks down the information into more specific categories, or buckets, that are enumerated below:
| Level 1 | Level 2 |
| 1 First Costs | |
| 01 Plan | |
| 02 Purchase | |
| 03 Design | |
| 04 Build | |
| 2 Known Needs | |
| 05 Deferred Maintenance (DMDs) | |
| 3 Recurring Costs | |
| 06 Maintain | |
| 07 Use | |
| 08 Utilities | |
| 09 Replace | |
| 10 Change | |
| 4 Last Costs | |
| 11 Divest | |
| 99 Escalation | |
| 99 Escalation |
Data Sources #
Data that is fundamental to the understanding of Total Cost of Ownership is derived from a number of sources: The FOScore® Assets Module; defaults within the TCO Module; Portfolio, Building, and/or Site defaults; and data that is specific to your asset(s).
Assets Module #
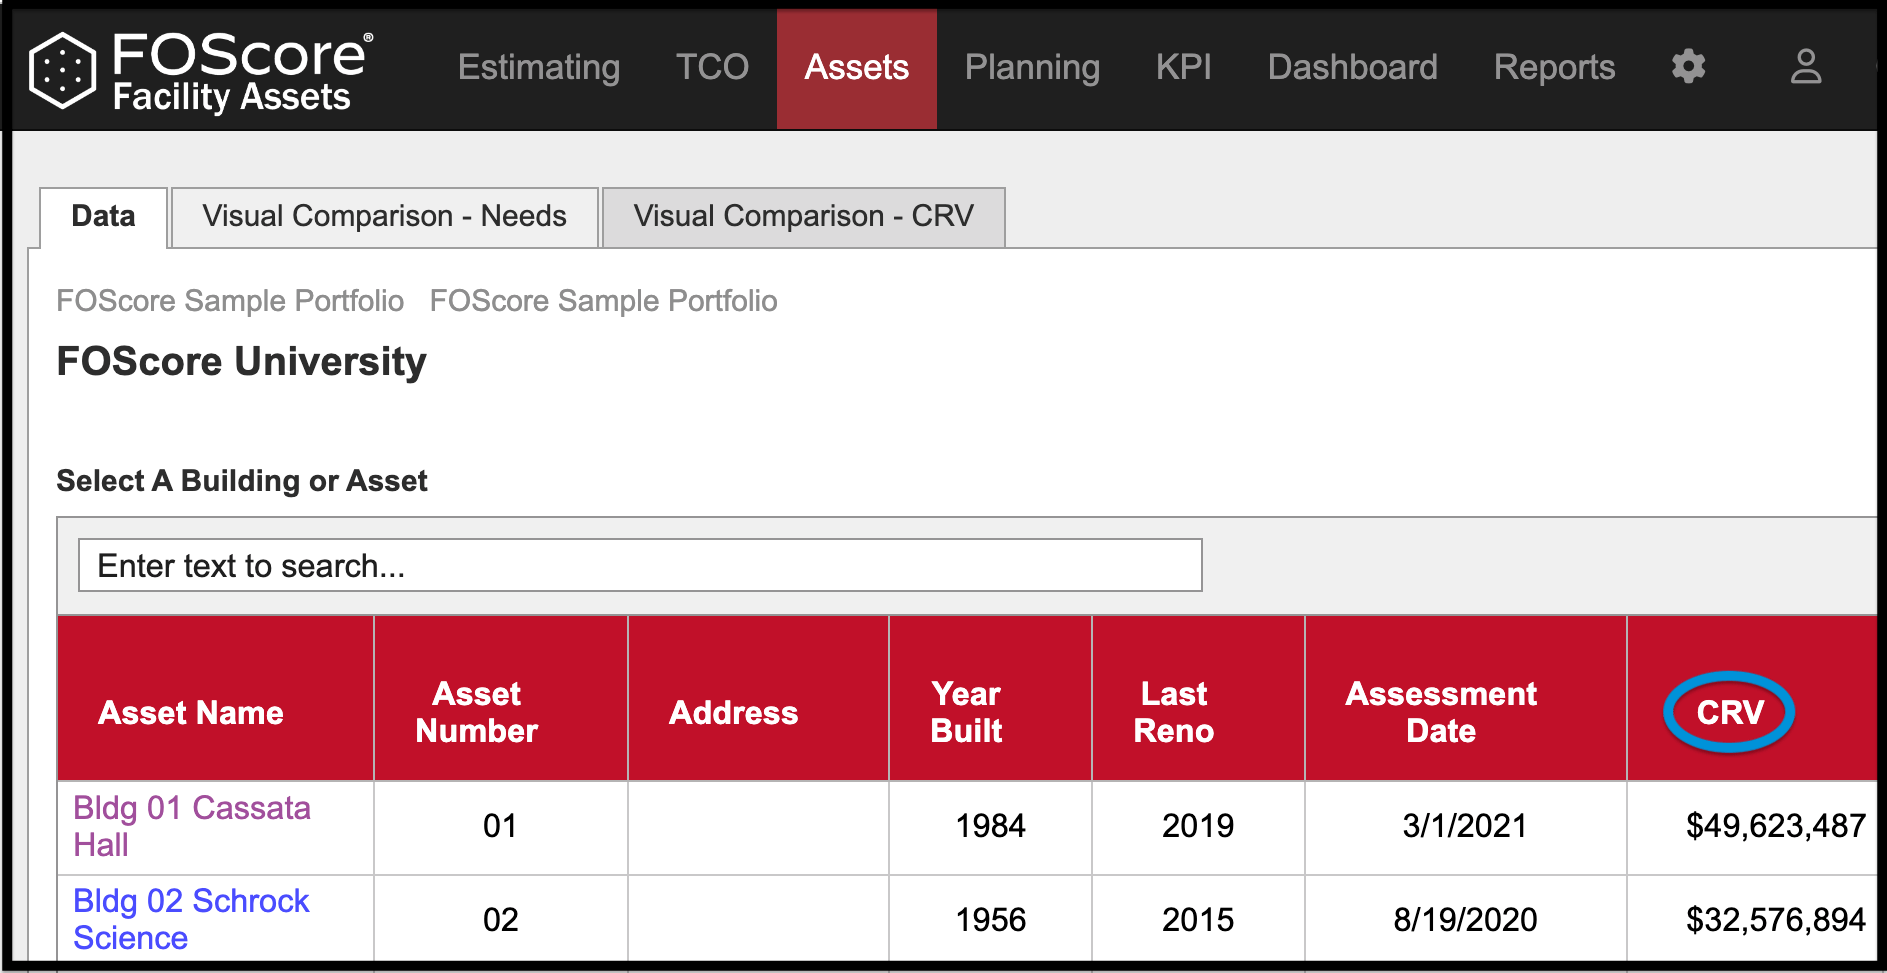
Within the FOScore® Assets Module, the CRV, or Current Replacement Value, is the value that represents the First Costs of TCO as ‘Build’ at Year 0.
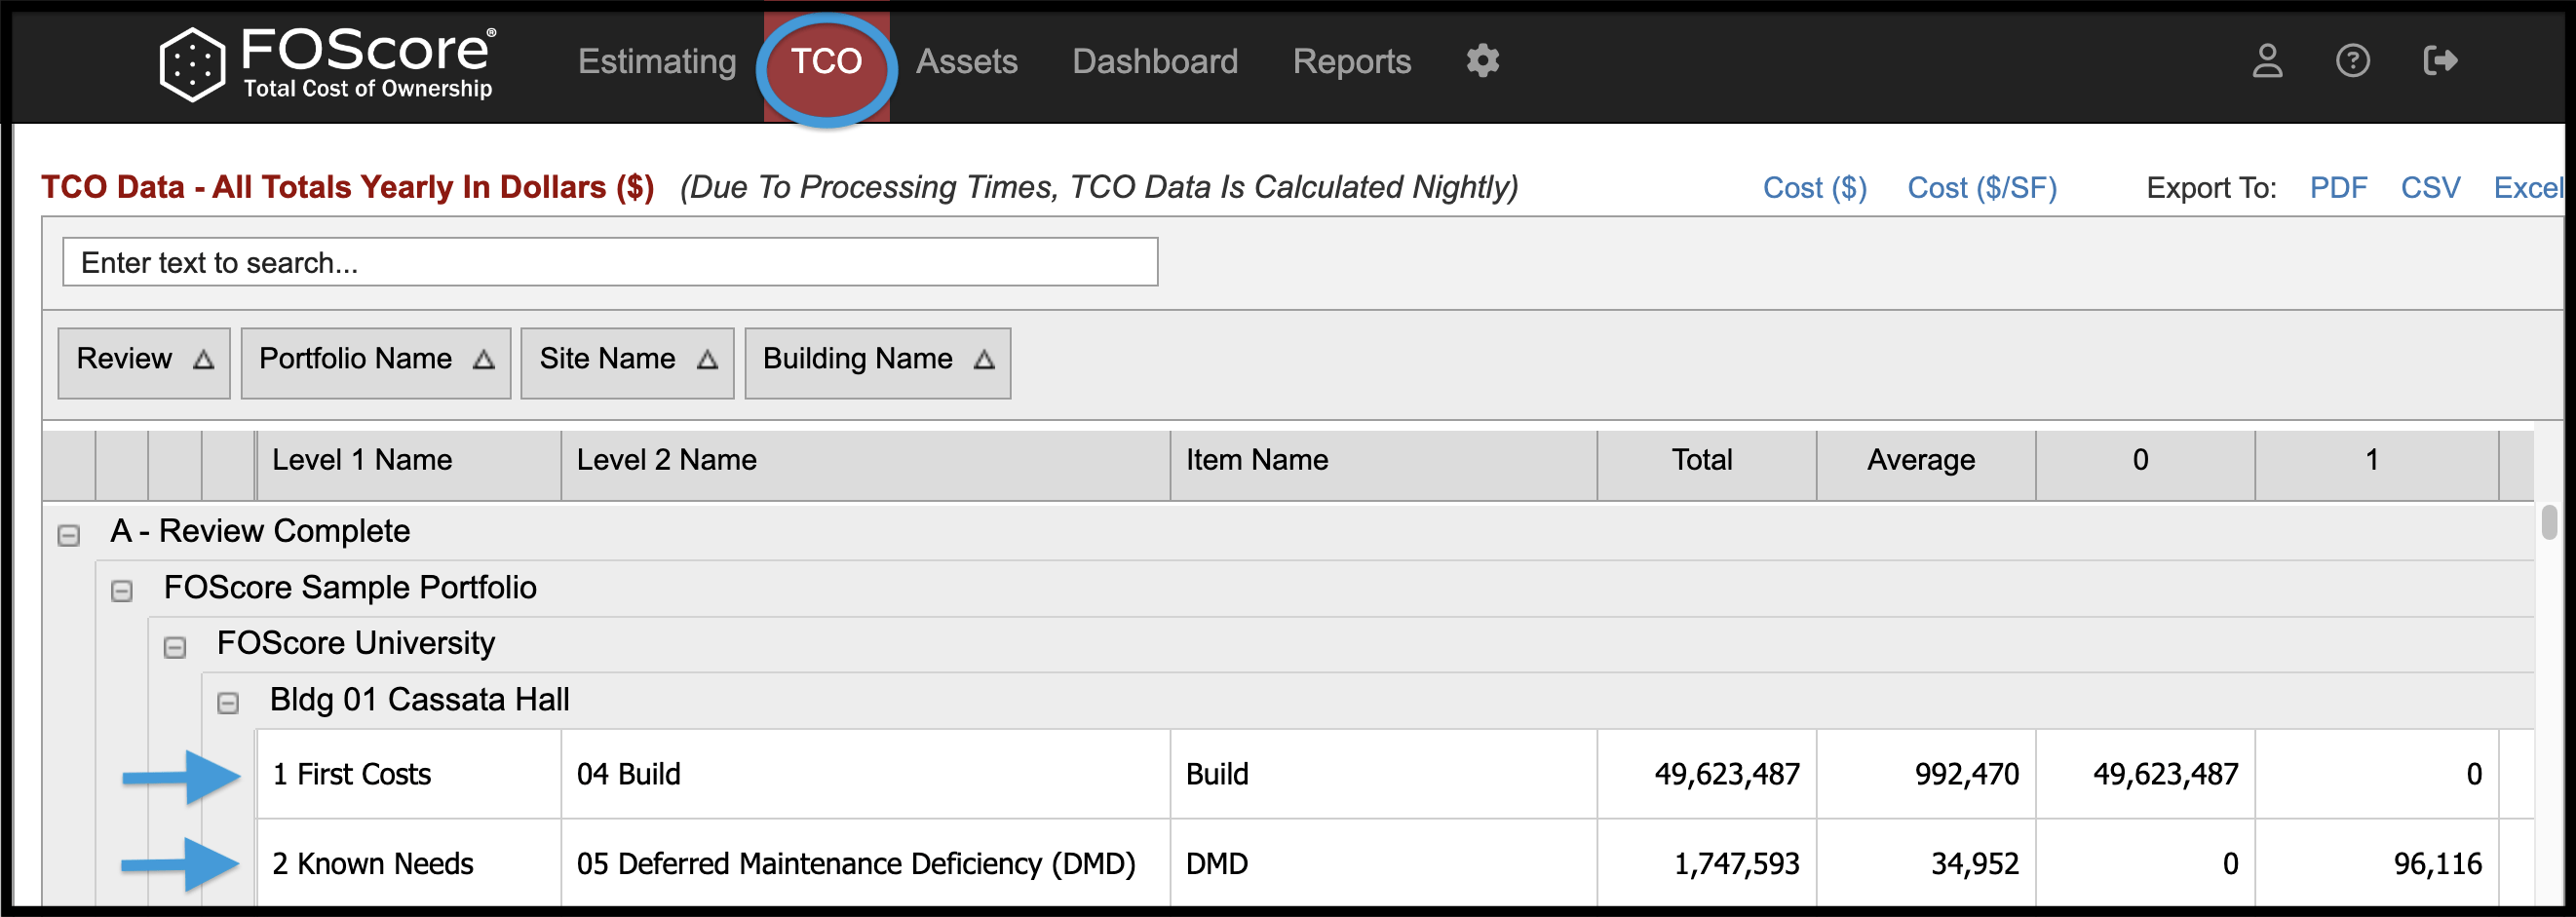
Assessment Action Costs equate to TCO Known Needs, Deferred Maintenance Deficiencies (DMDs) at the Action Timeframe, as shown below.

TCO-Related Client Settings #
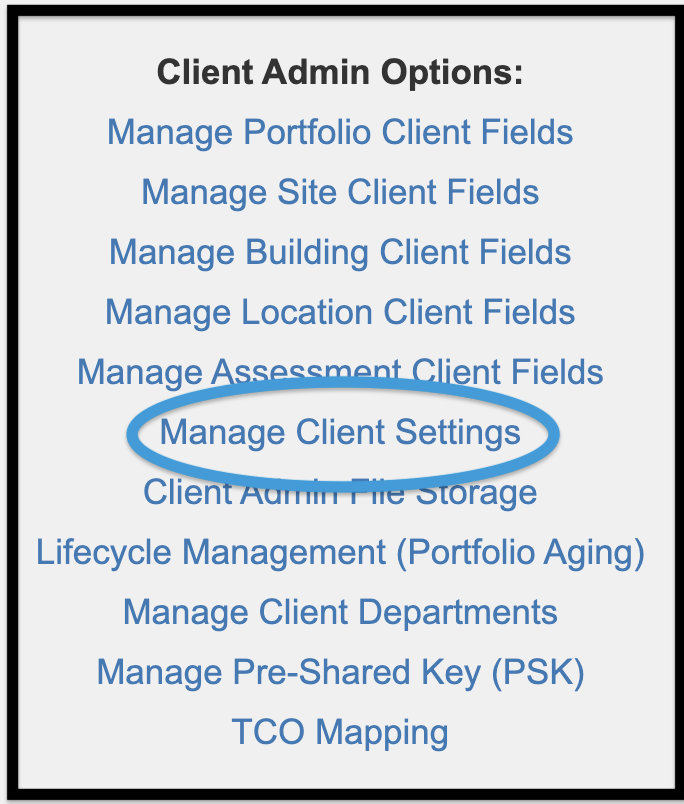
To access TCO-related settings, go to the Admin Module (the gear icon in the navigation bar) and click on the Manage Client Settings link which is located in the Client Admin Options section.
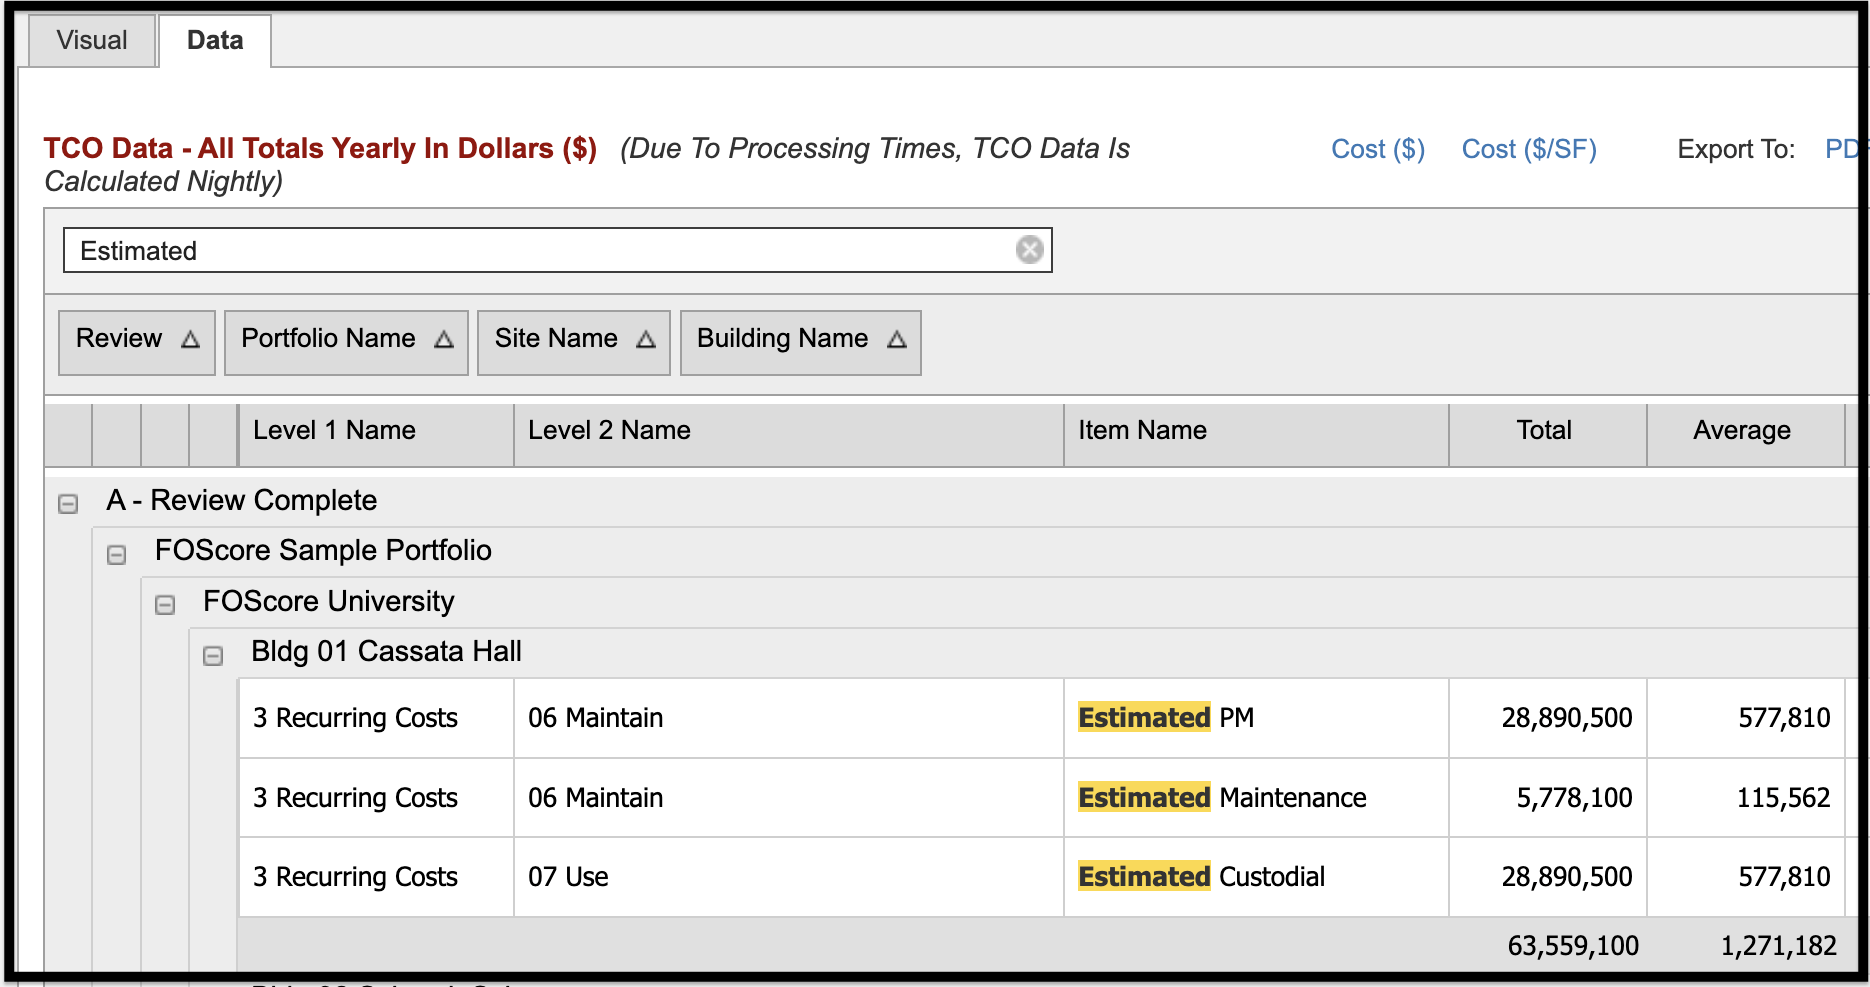
As mentioned previously, if no asset-specific values exist, Portfolio/ Site/Building Type defaults are used. If no Portfolio/Site/Building Type defaults exist, Module defaults are used. These default values are Cost Per Square Foot and occur yearly except for Divest which is one-time at year 50. Default values are assigned the label ‘Estimated’ in the TCO data grid.
TCO Module Defaults #
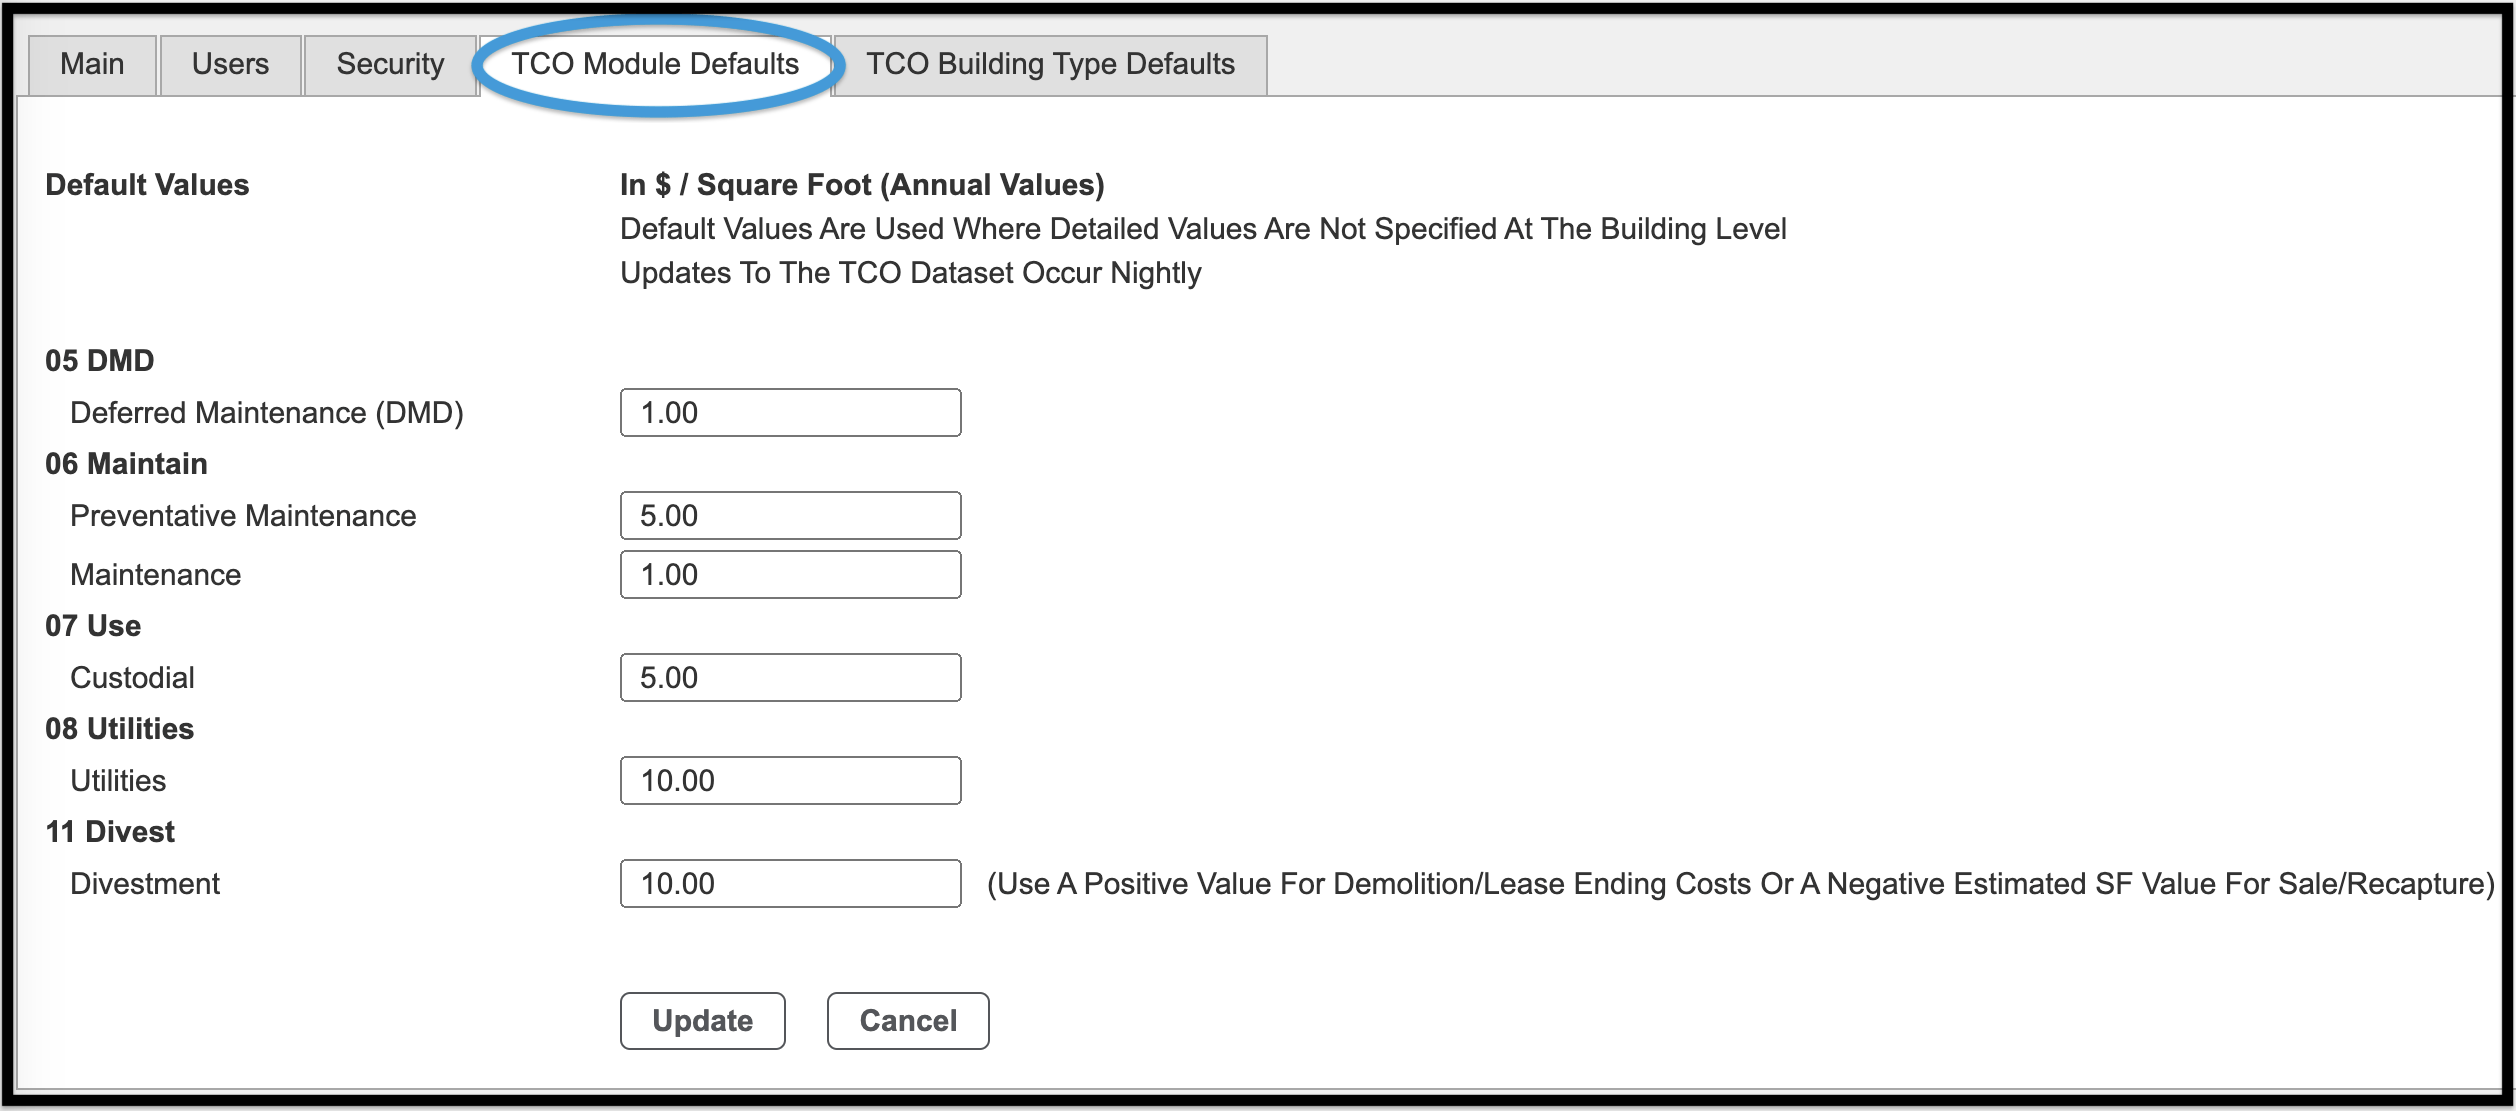
The TCO Module Defaults tab provides the option of setting default values for the module. These are used where values are not specified at the Portfolio/Site/Building Type.
TCO Building Type Defaults #
The TCO Building Type Defaults tab provides an option to set values in a grid displaying building type and TCO item.
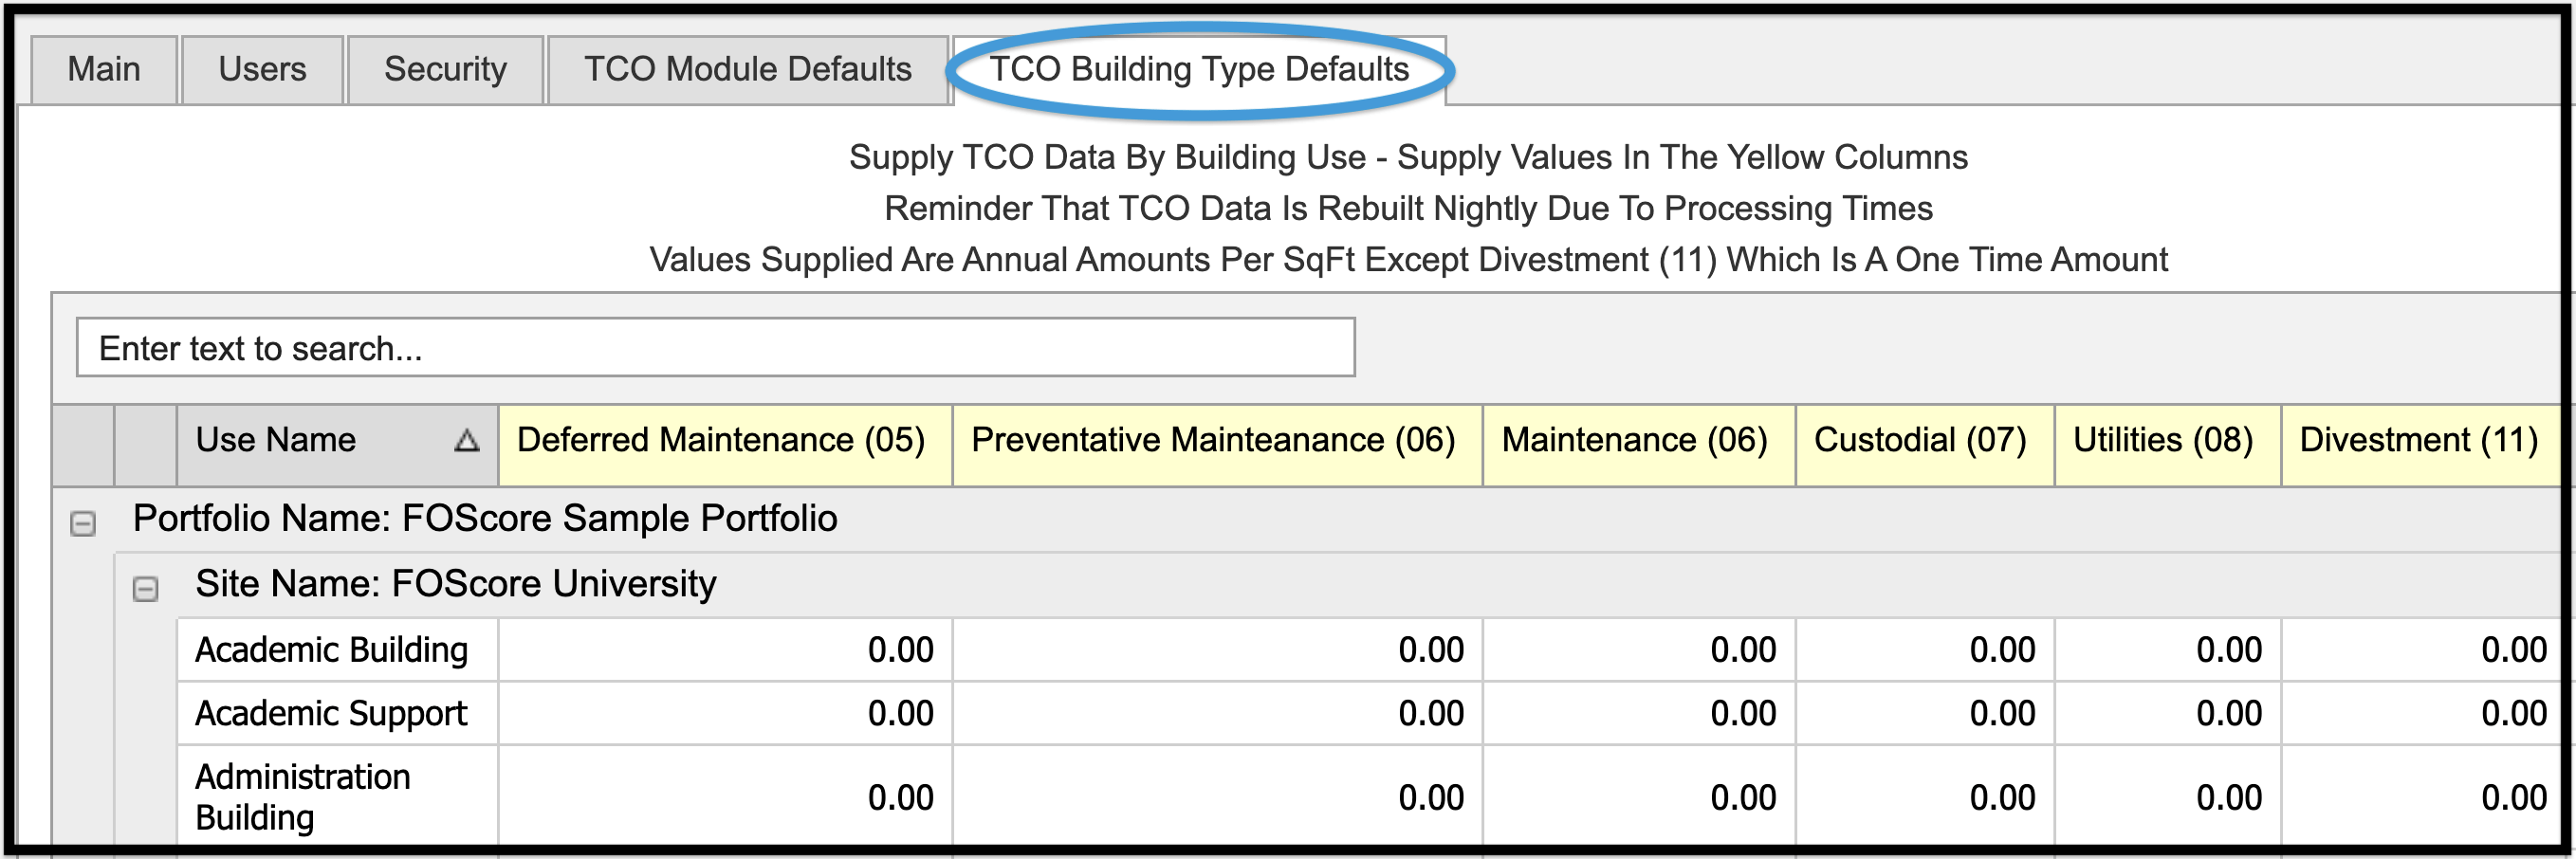
On this page, you will supply TCO data by building use. Values will be entered in the columns with yellow headers. Values supplied are annual amounts per square foot, except for divestment (11) which is a one-time amount per square foot. If you have more than one portfolio, the building type could have different costs assigned. For example, a client with multiple portfolios could have different costs assigned to the Academic Building type in each portfolio.
Asset-Specific Data #
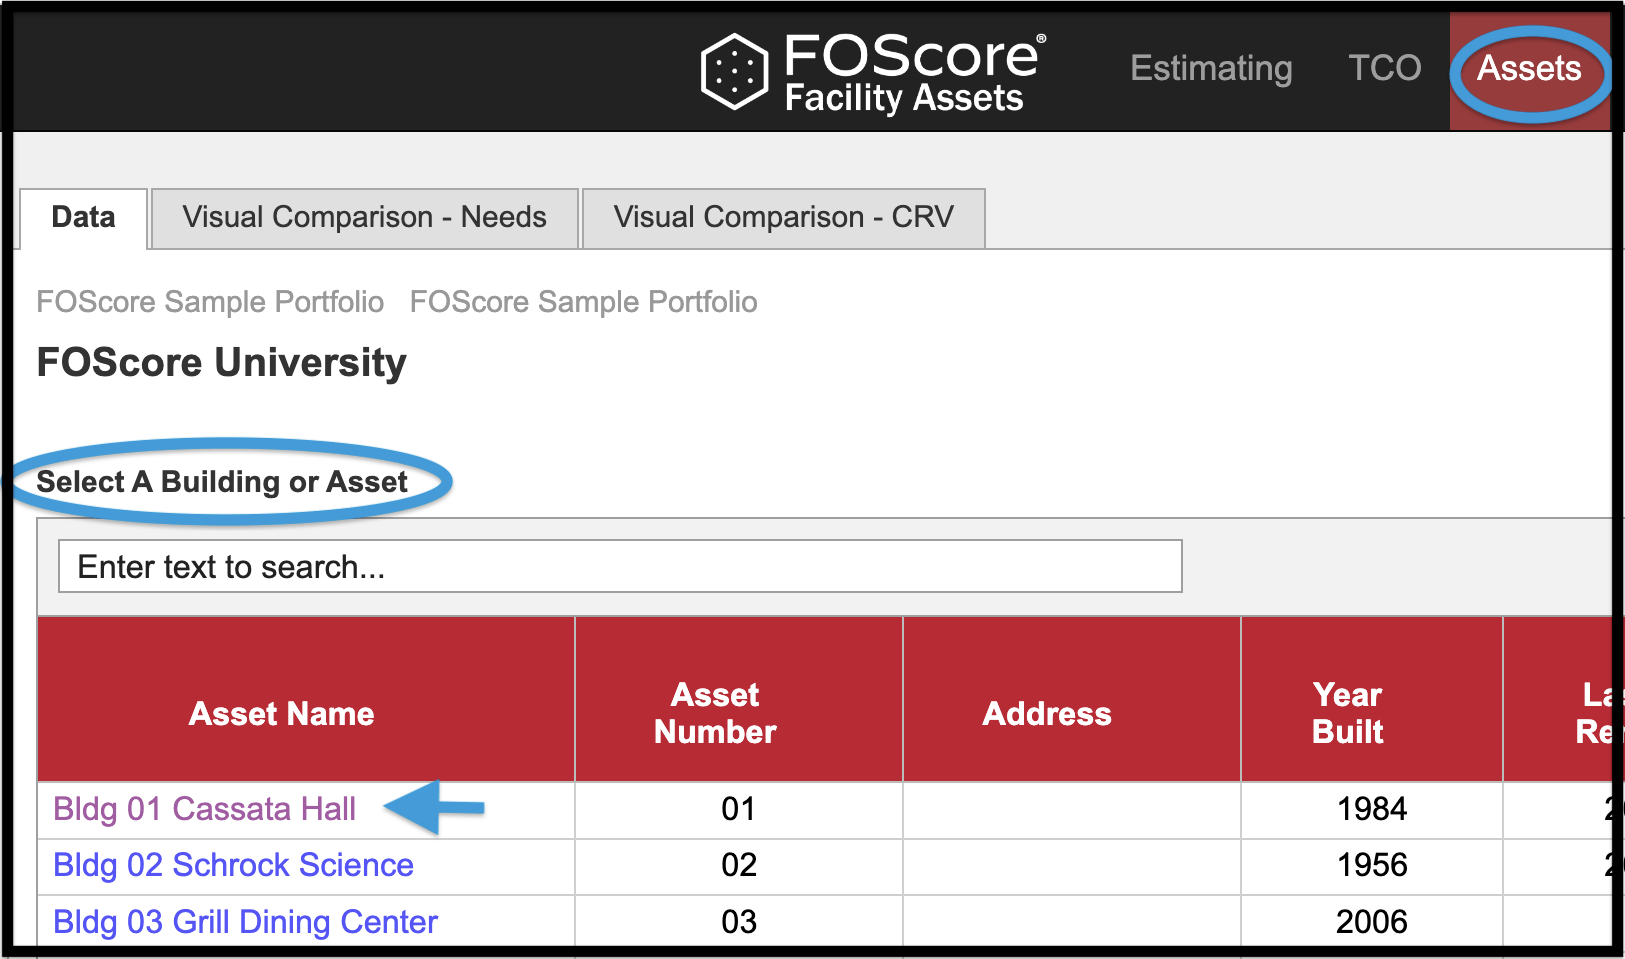
Data contained in this screen is building-specific. To navigate to this screen, click the Assets Module on the navigation bar and select the desired building or asset from the Asset Name column. The TCO Data tab is located near the right side of the screen as shown below.
Click on the TCO Data tab to Add, Edit, or Delete building-specific costs.

To add building-specific cost data, click New.

- Provide the following information:
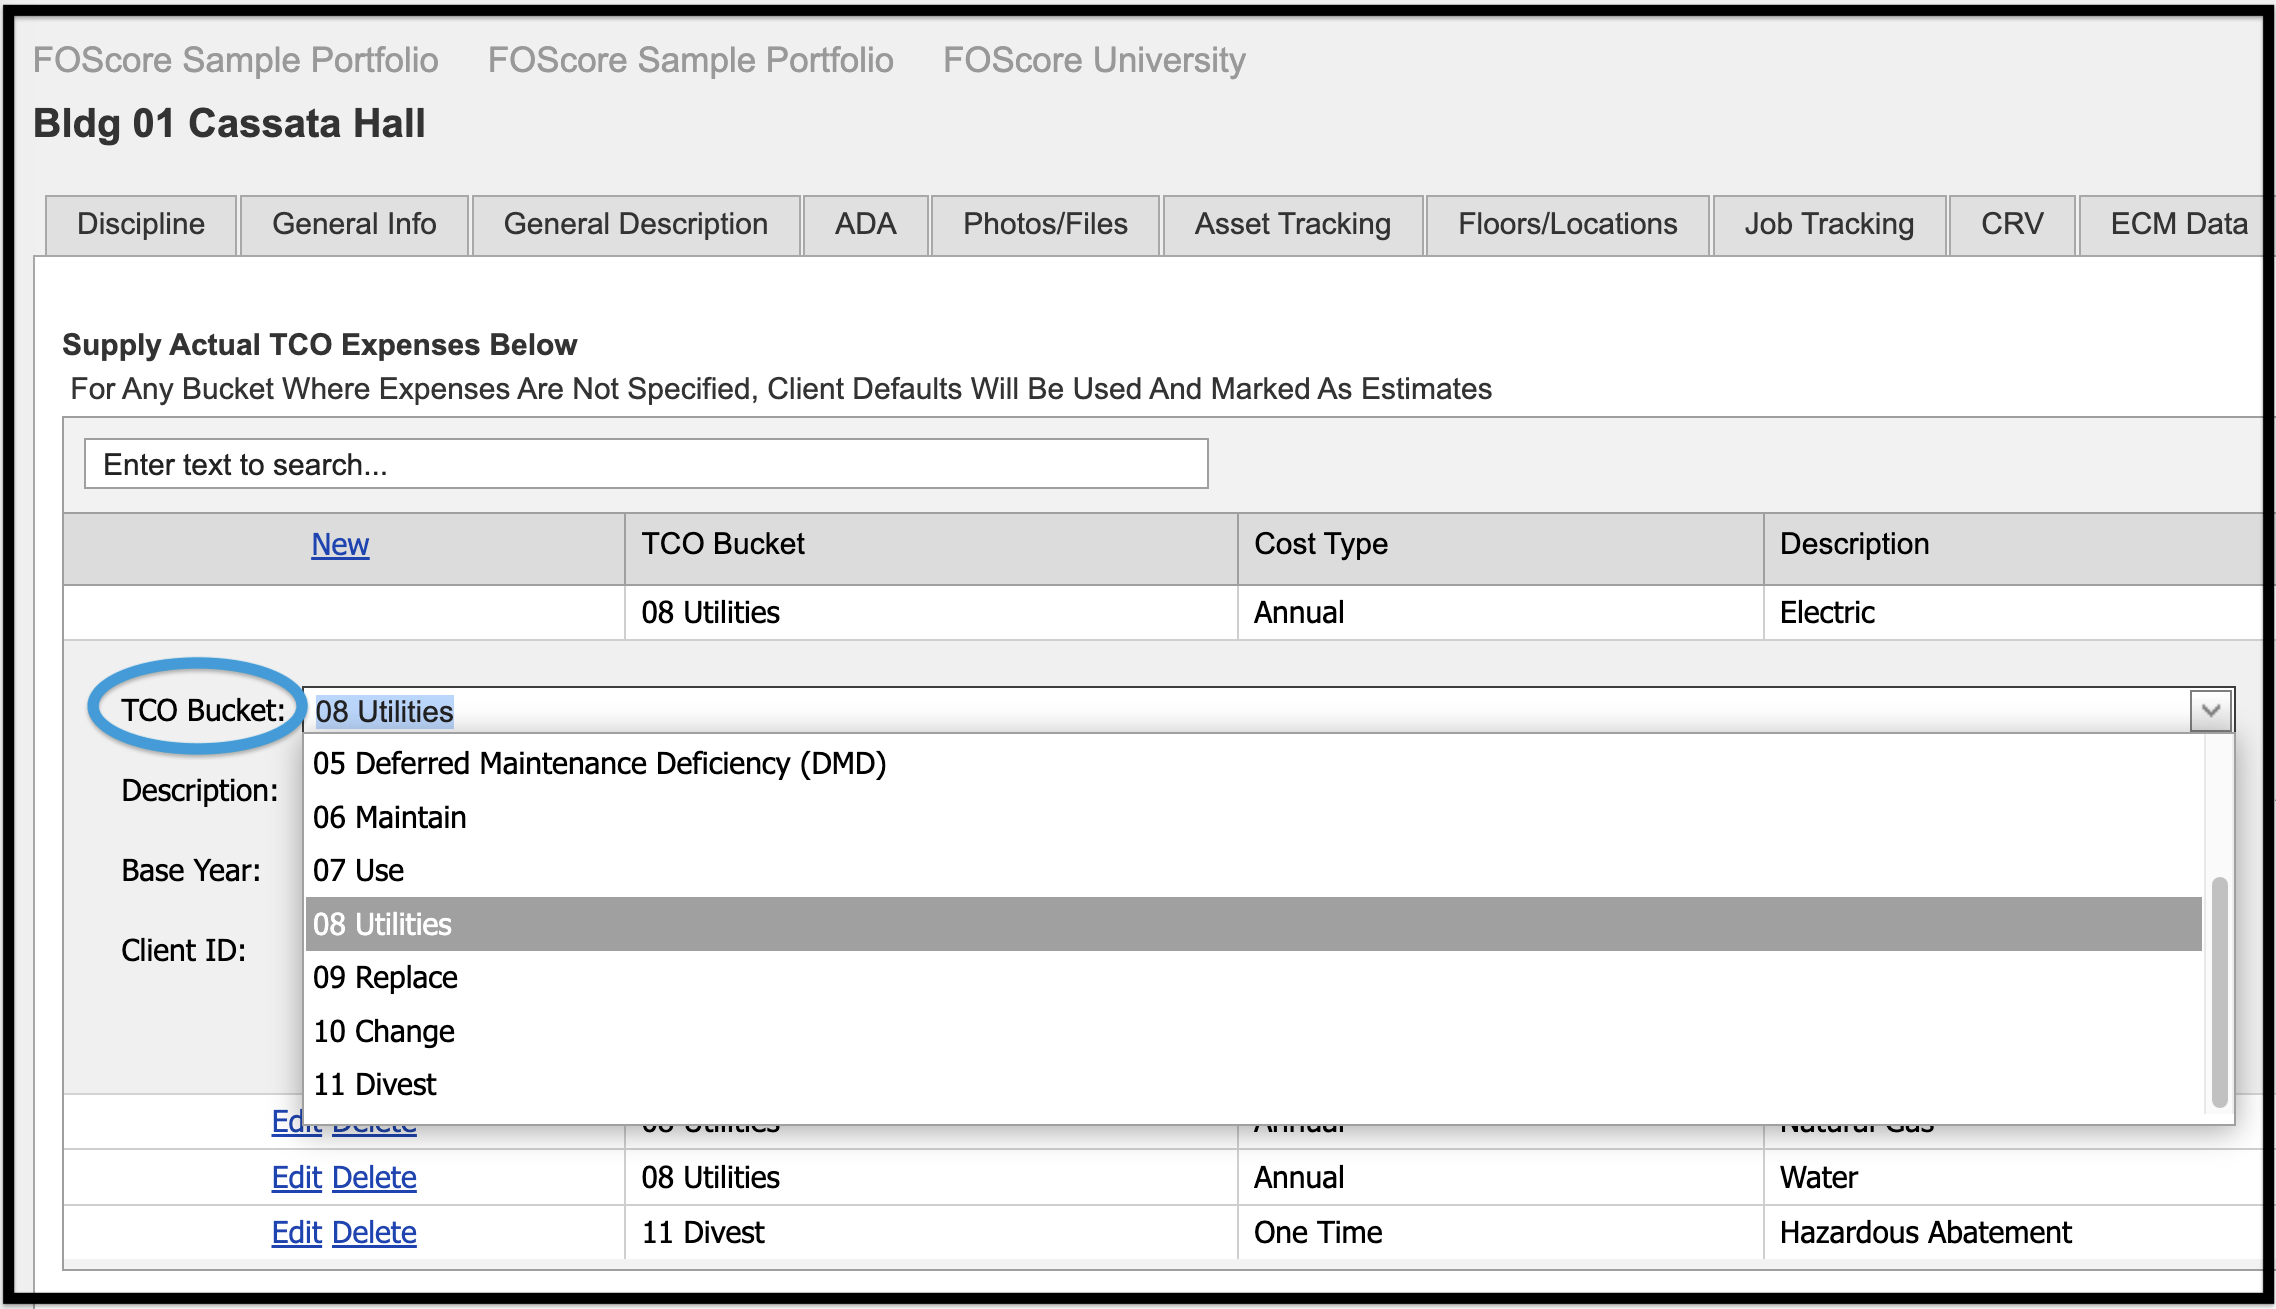
- TCO Bucket–One of the 11 Level 2 cost categories outlined in the grid above (01 Plan is shown)
- Description
- Base Year–the year in which the cost begins
- Client ID is prepopulated and not editable
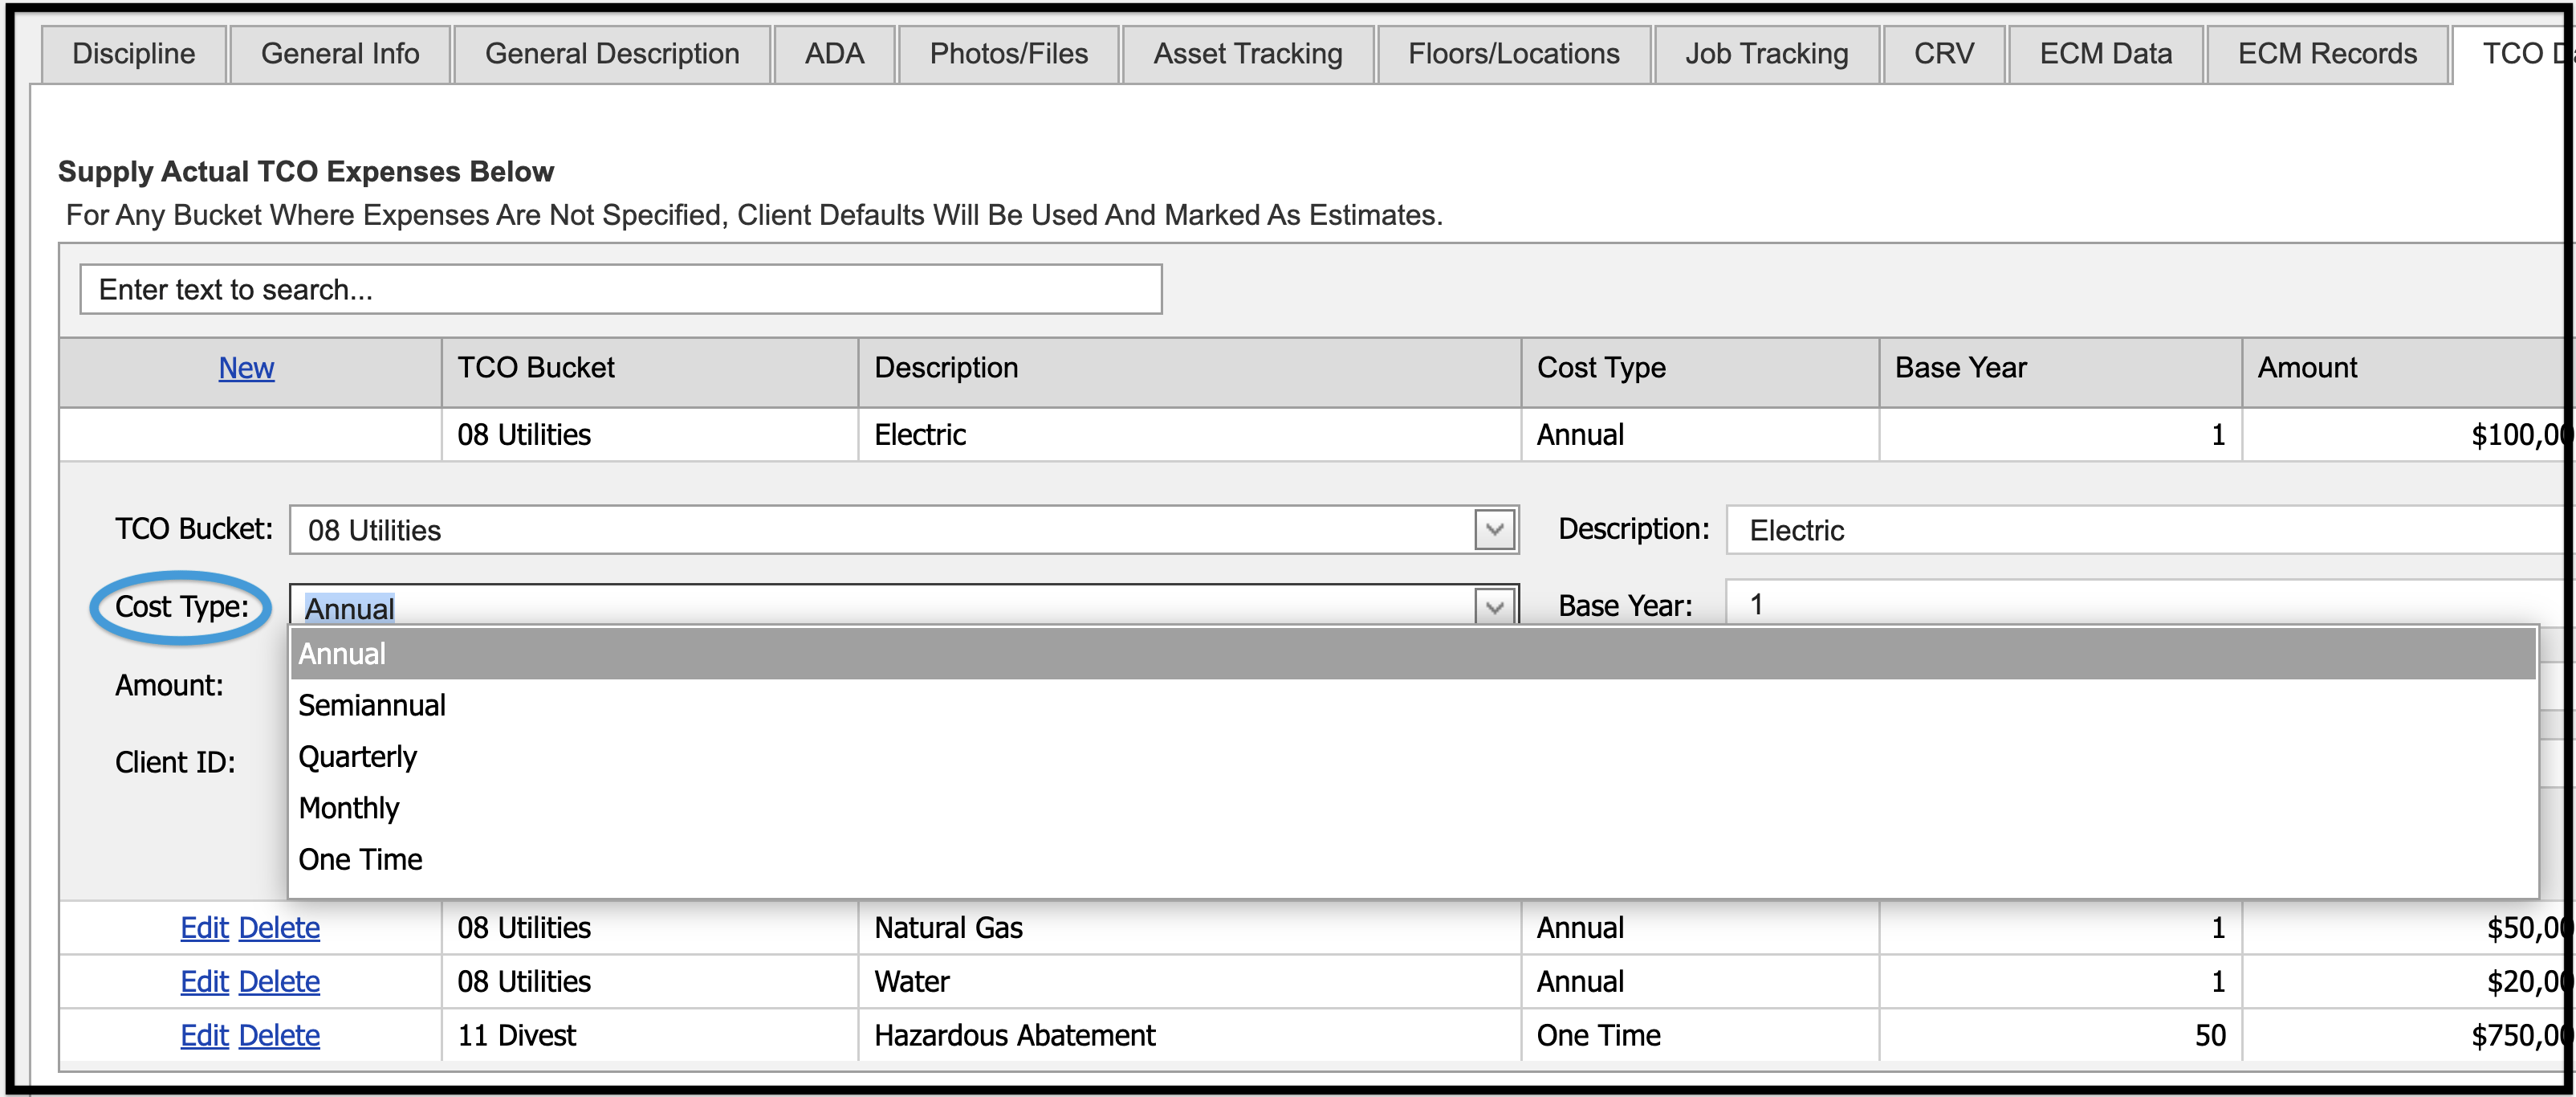
- Cost Type–select either annual or one-time
- Amount
- Building ID is prepopulated and not editable
- When you are finished adding information, click Update. To continue without saving the new information, click Cancel.
- For any cost category (bucket) in which data has not been entered at the building or asset level, client defaults will be used and marked as estimates.
To edit building-specific cost data, click Edit.

- On the next screen, you will select the TCO Bucket and Cost Type from the drop-down menus.
- Change any data that needs to be updated in the remaining fields.
- Note that Client ID and Building ID are not editable fields.
- When you are finished adding information, click Update. To continue without saving the new information, click Cancel.
As a reminder costs are calculated in a tiered structure.
- If no Asset-Specific values exist, costs will be drawn from the TCO Building Type Defaults tab.
- If no data has been entered in the TCO Building Type Defaults section, the software will draw data from the TCO Module Defaults tab.
- If TCO Building Type Default data exists, it is more exact and would override any values that were entered in the TCO Module Defaults tab.
Visual #
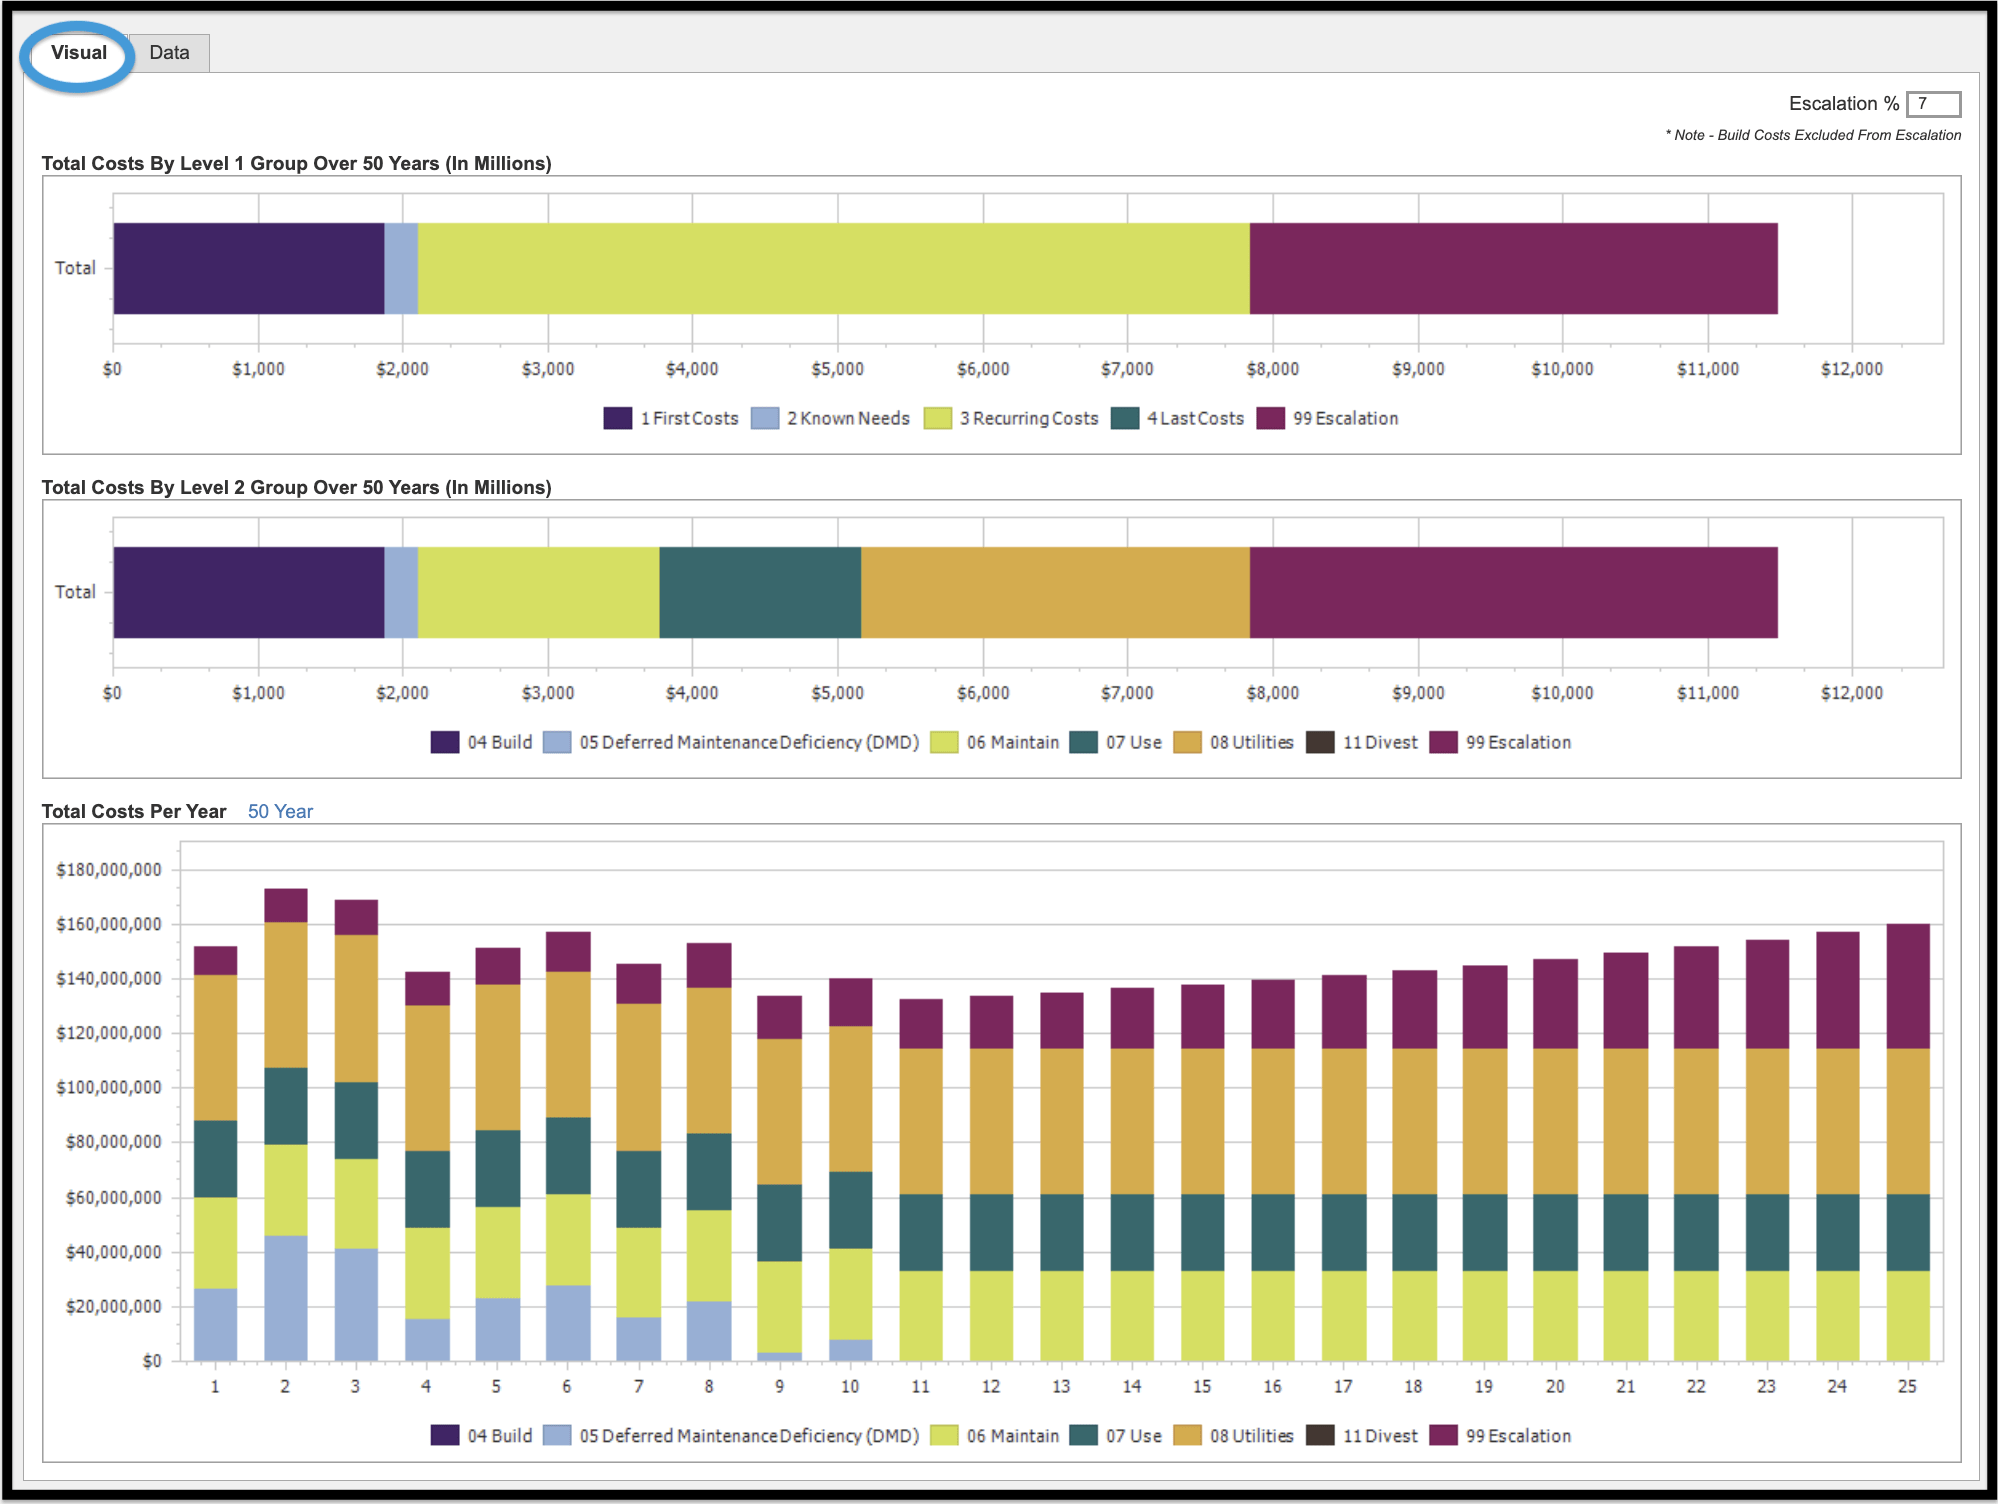
The TCO Visual tab provides an overview of costs while the Data tab provides options for a deeper review including filtering.
Escalation #
Escalation is an increase in the cost of a product, service, or commodity over time. In the context of facility assessment data, escalation should accurately represent the expected rise in cost over time of building materials and labor, which may be substantially higher or lower than the inflation rate in the economy. The TCO Visual tab features the ability to enter a percentage for escalation that will enable you to view its impact over time.
As is noted in the software, build costs are excluded from escalation.
A sample of how an escalation factor of 7% changes the visual representation of cost is shown in the two images below.
Total Costs by Group #
Level 1 #


Level 2 #
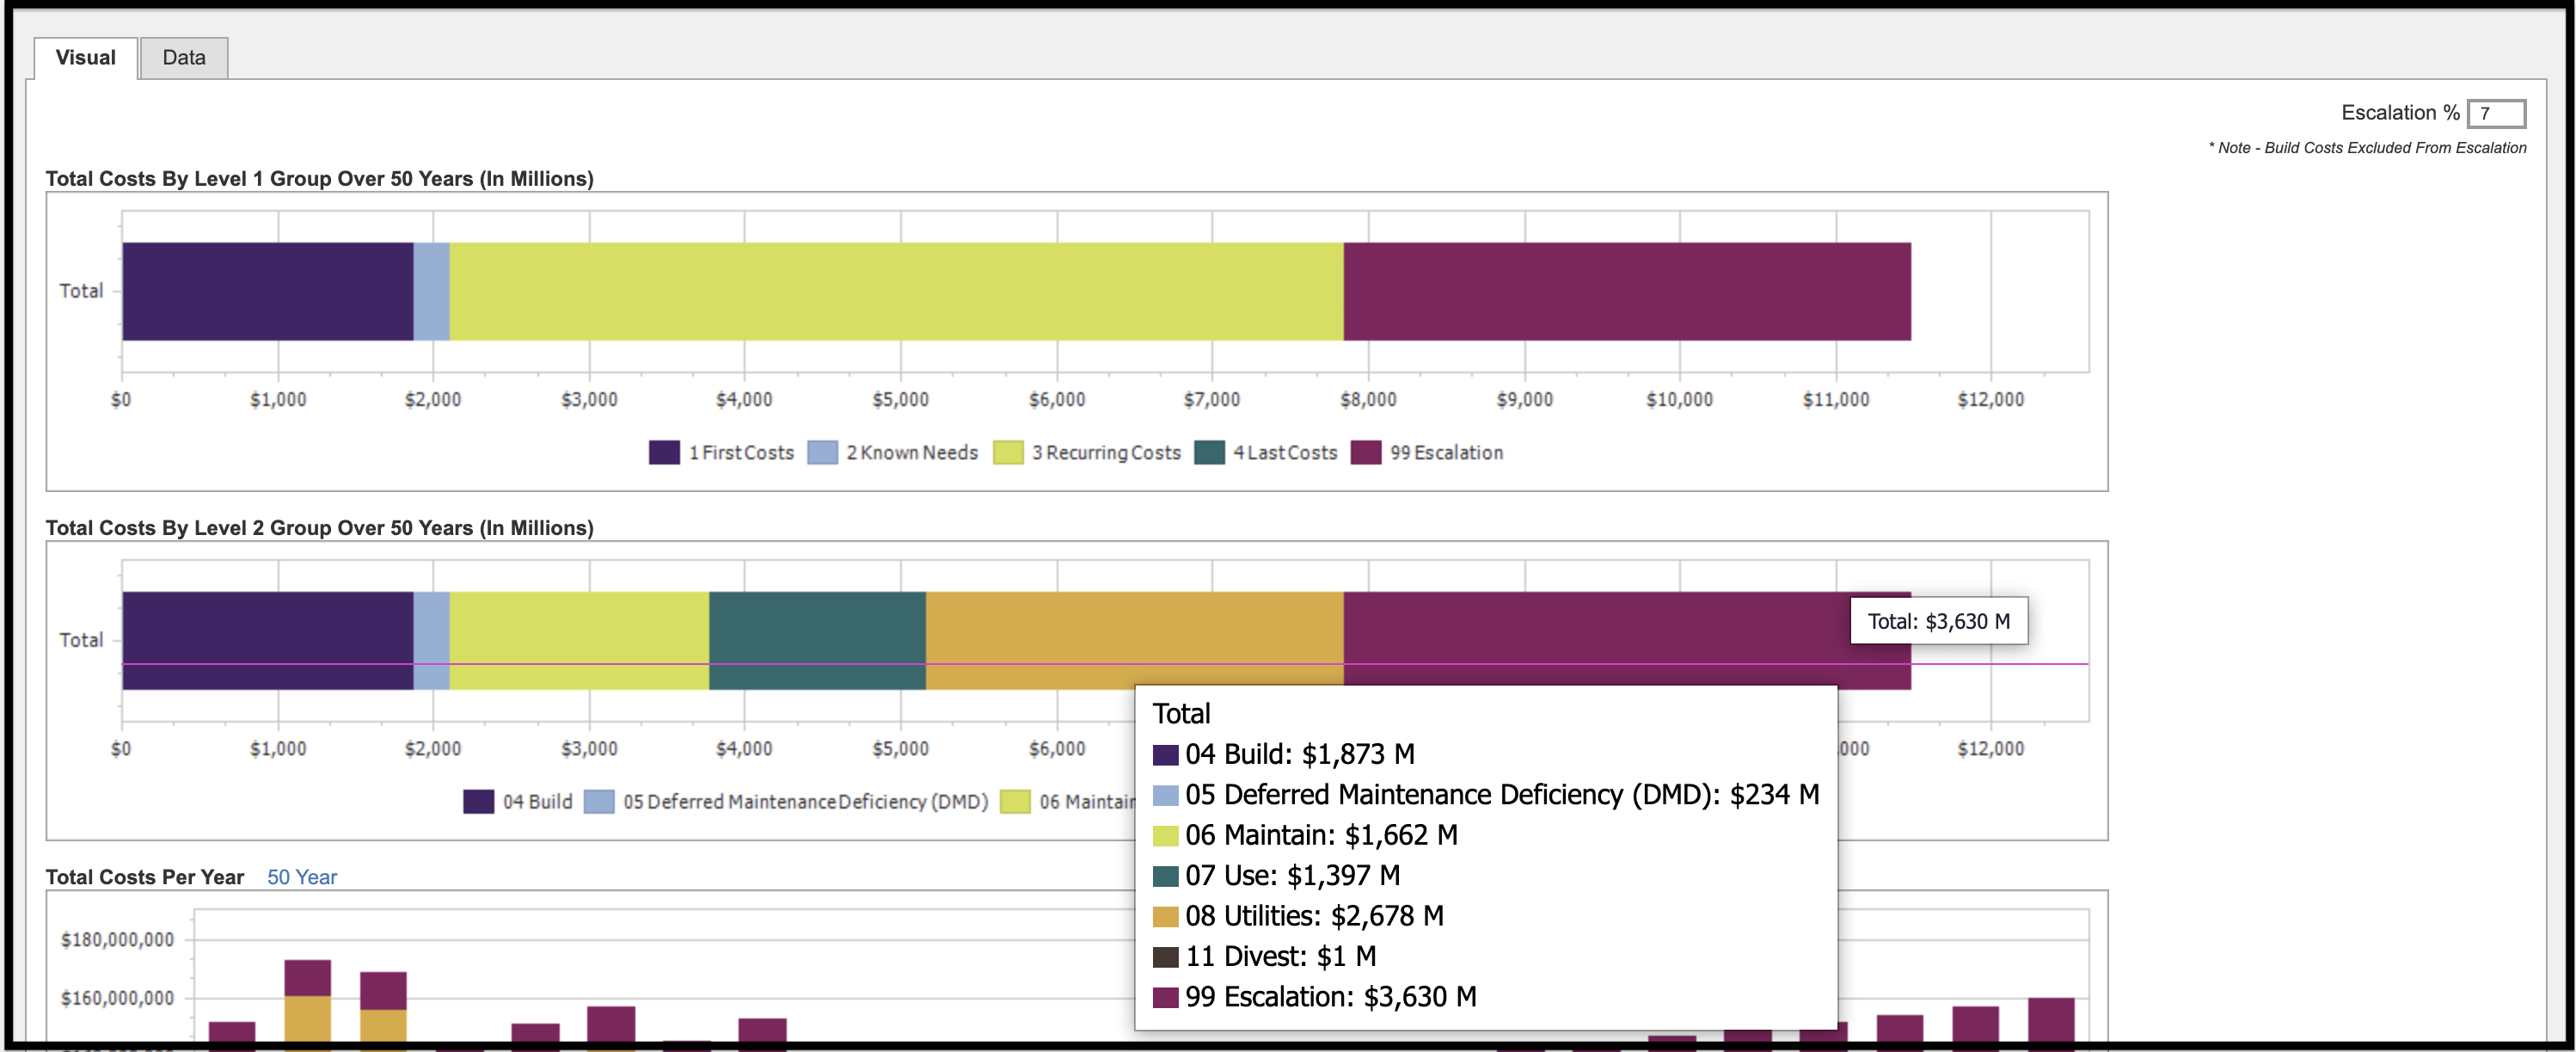
The image below, which shows Level 2 Costs in the second graph, also highlights hover notes as a feature in the Visual tab. Simply track your mouse across the graph to view the additional data contained in hover notes.
Total Costs Per Year #
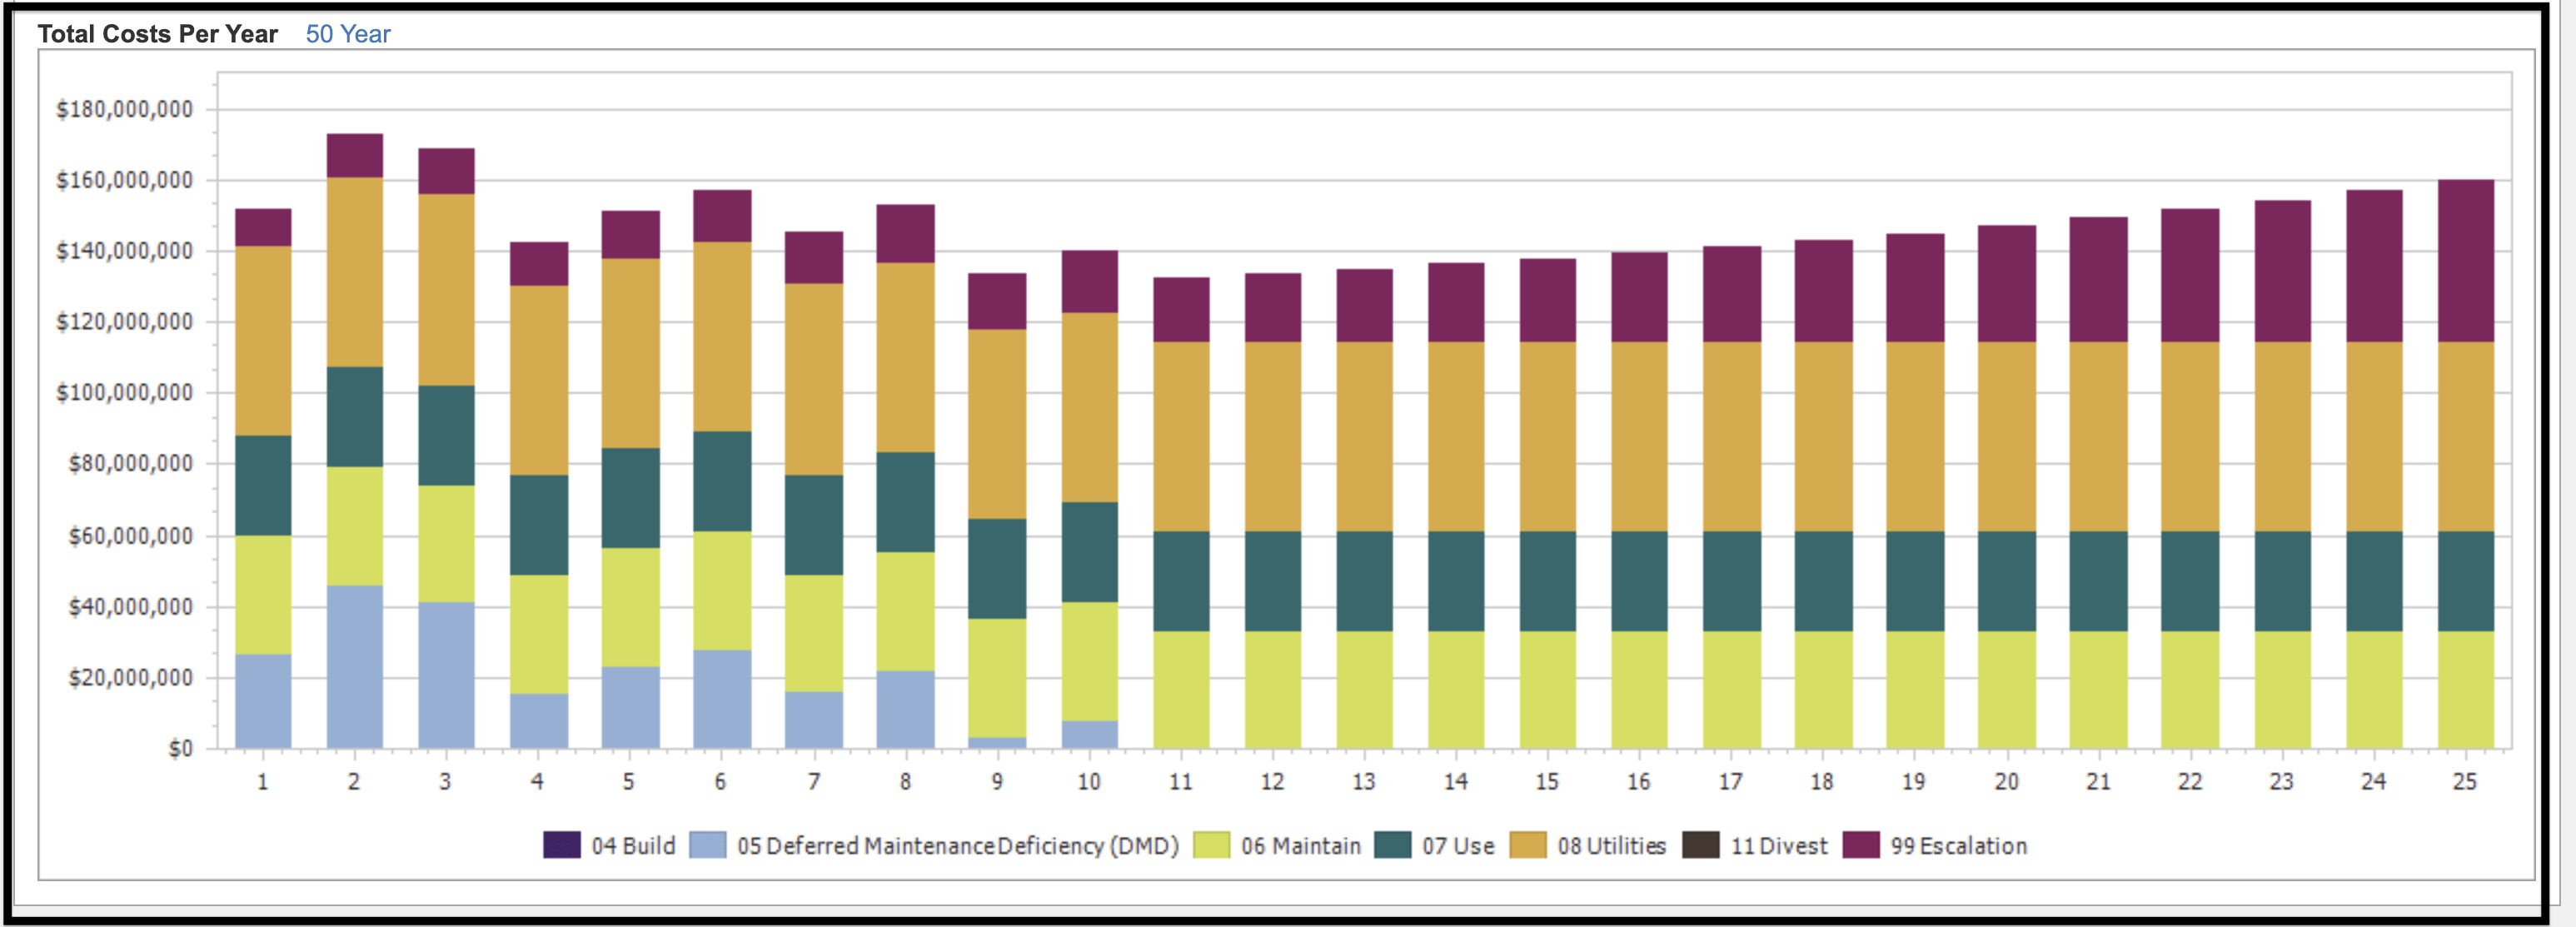
Views are available for Total Cost Per Year for 25 years and 50. Click the 25 year/50 year link to toggle back and forth between the two.


Data Grid #
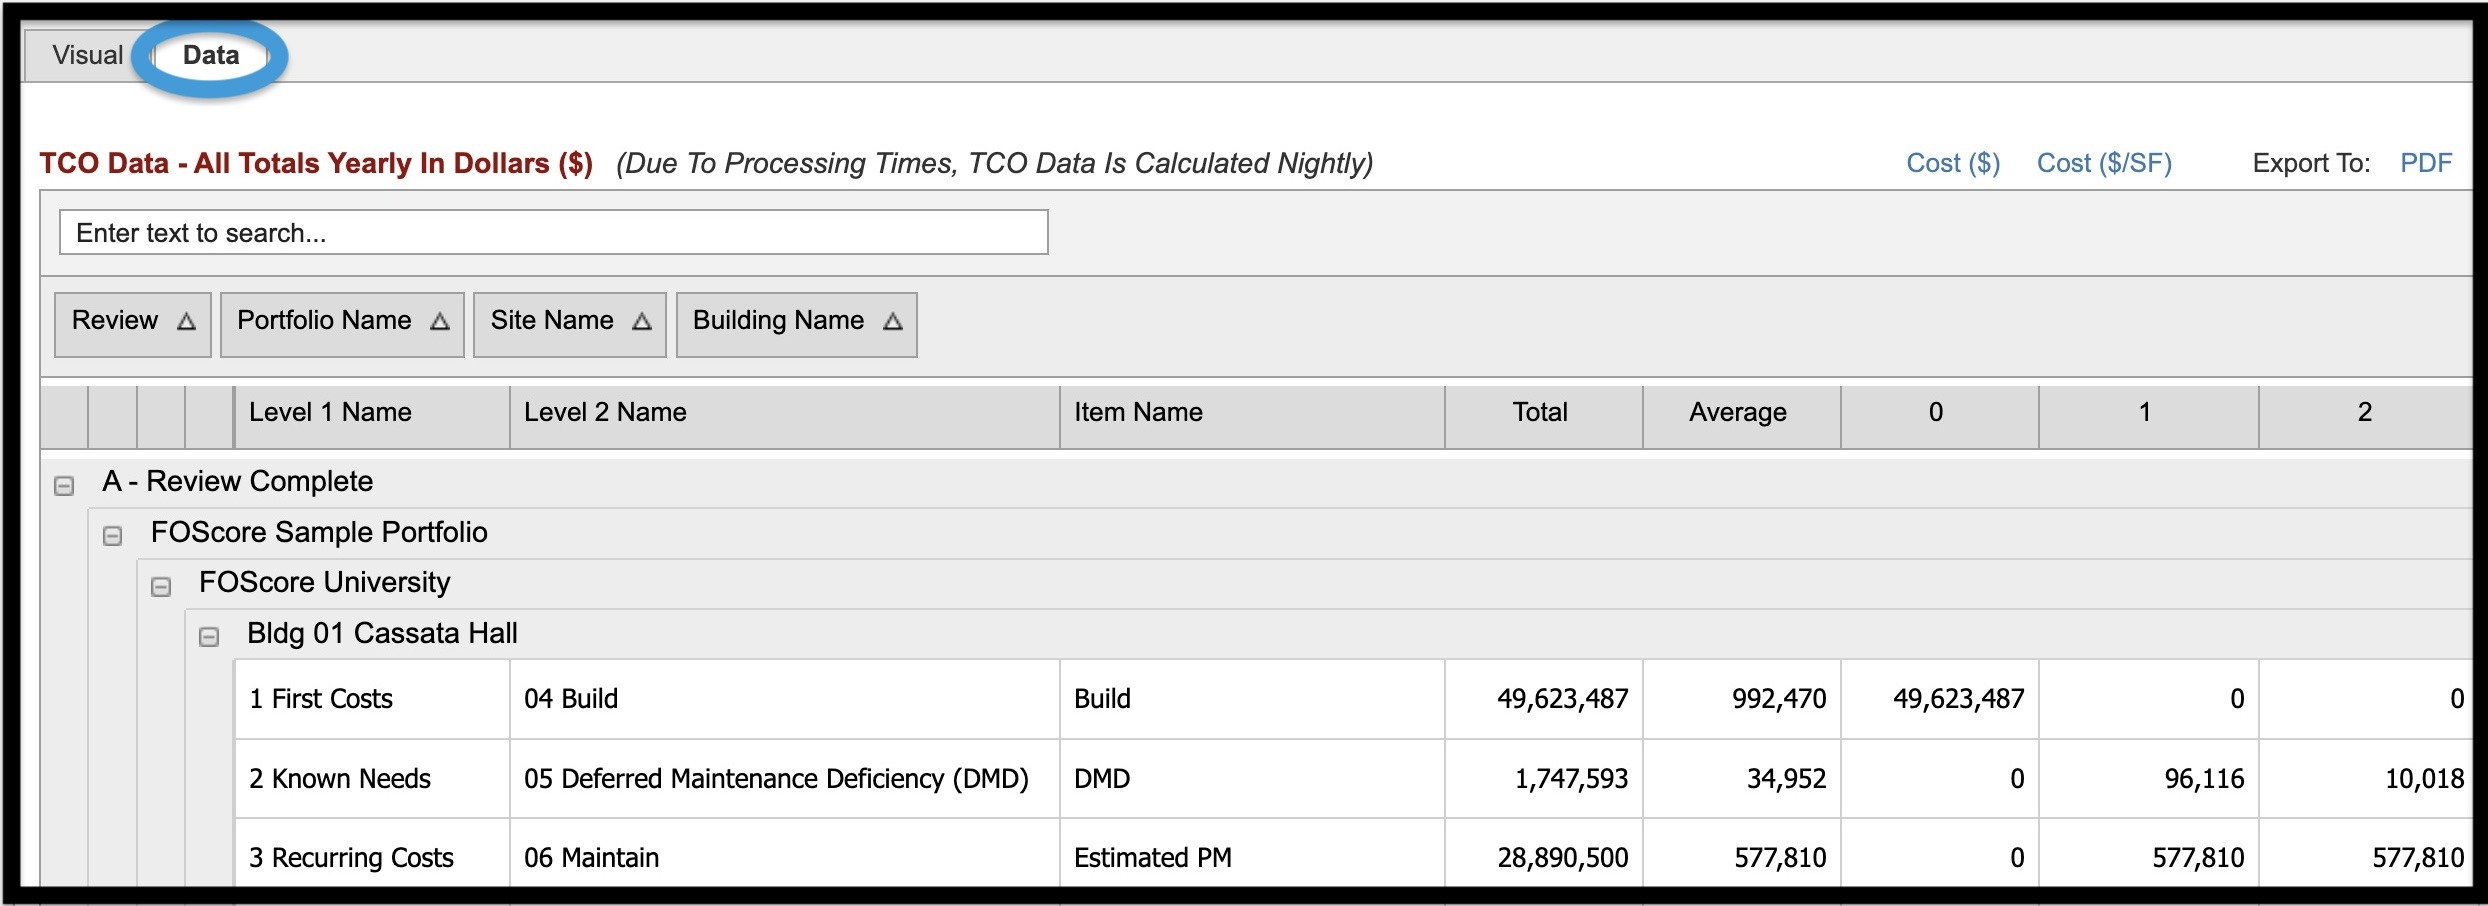
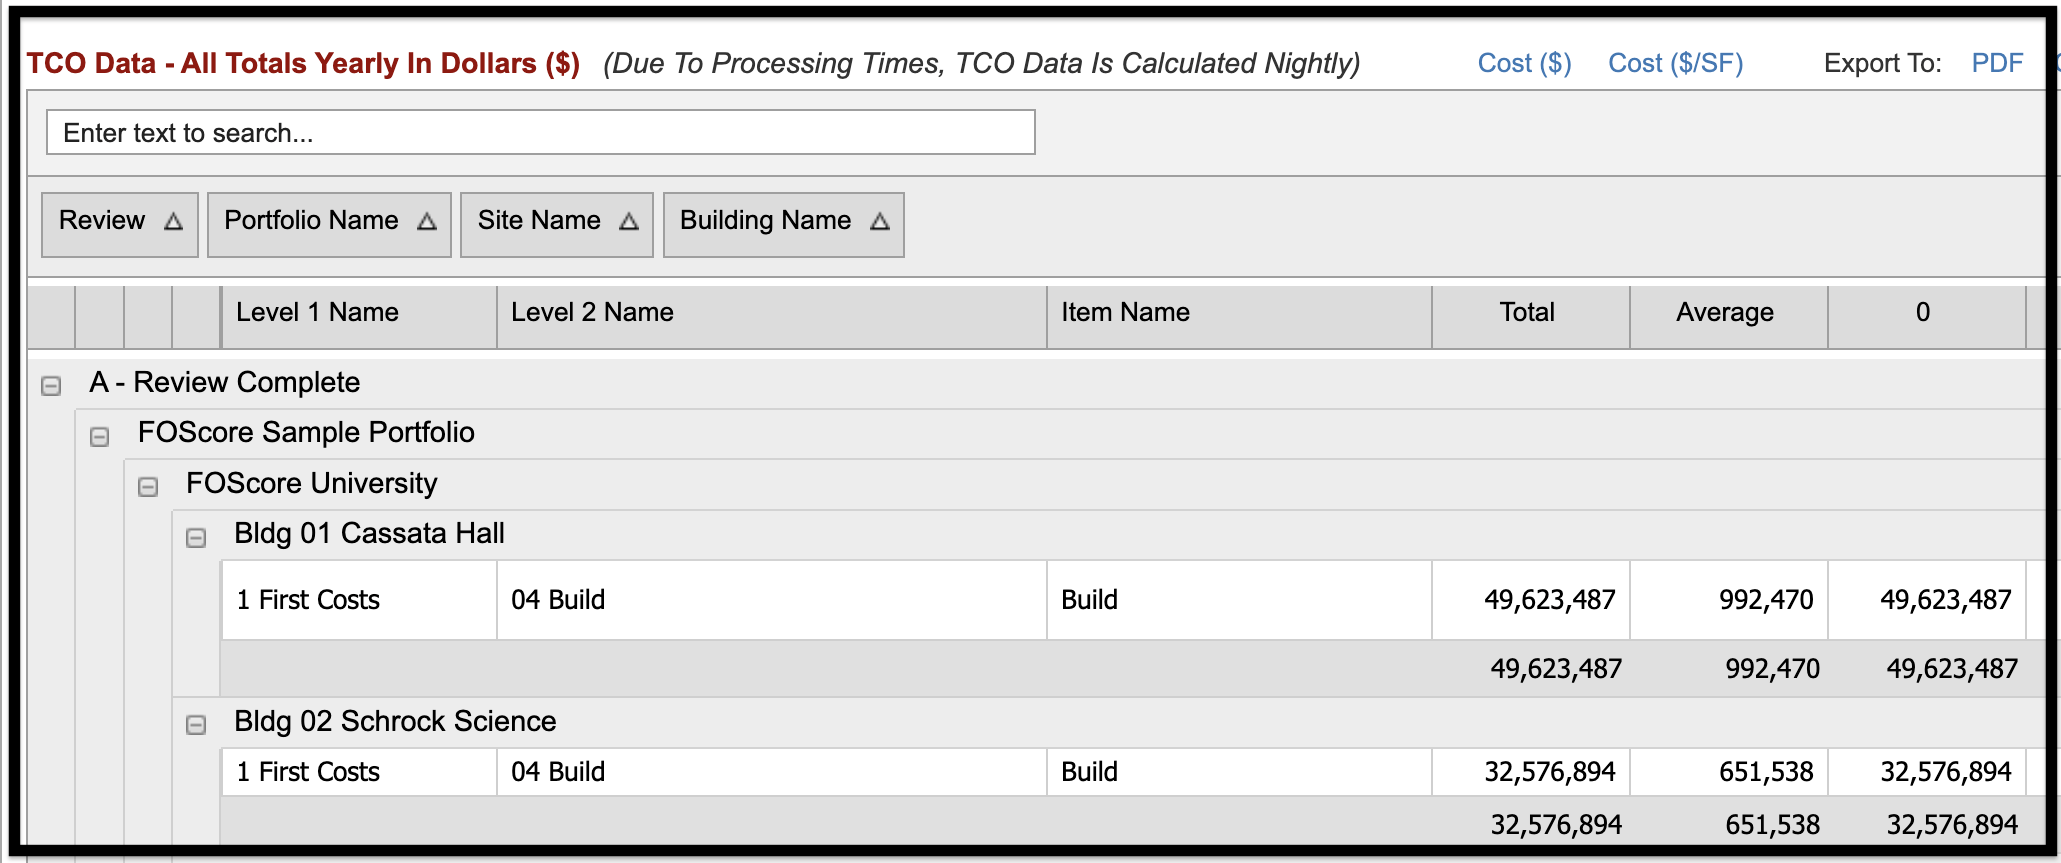
The TCO Module Data Grid is accessed by clicking on the TCO heading on the navigation bar. The grid features the ability to group, sort, and filter data fields. In the example shown below, the grid is grouped by Review Status, Portfolio Name, Site Name, and Building Name (this is the default display setting).
Data Grid Features #
The following information is represented in the TCO Module Data Grid:
- Review Status
- Portfolio Name
- Site Name
- Building Name
- Costs
- Level 1 (Cost) Name
- Level 2 (Cost) Name
- Item Name
- Total
- Average
- Known Costs for Years 0 through 50 (Year 0 is the build year and represents the CRV from the Assets Module.)
You can sort information within the grid by clicking on a column heading. Click the heading name once to sort in ascending order, click the heading twice to sort in descending order.
Select a Display Format #
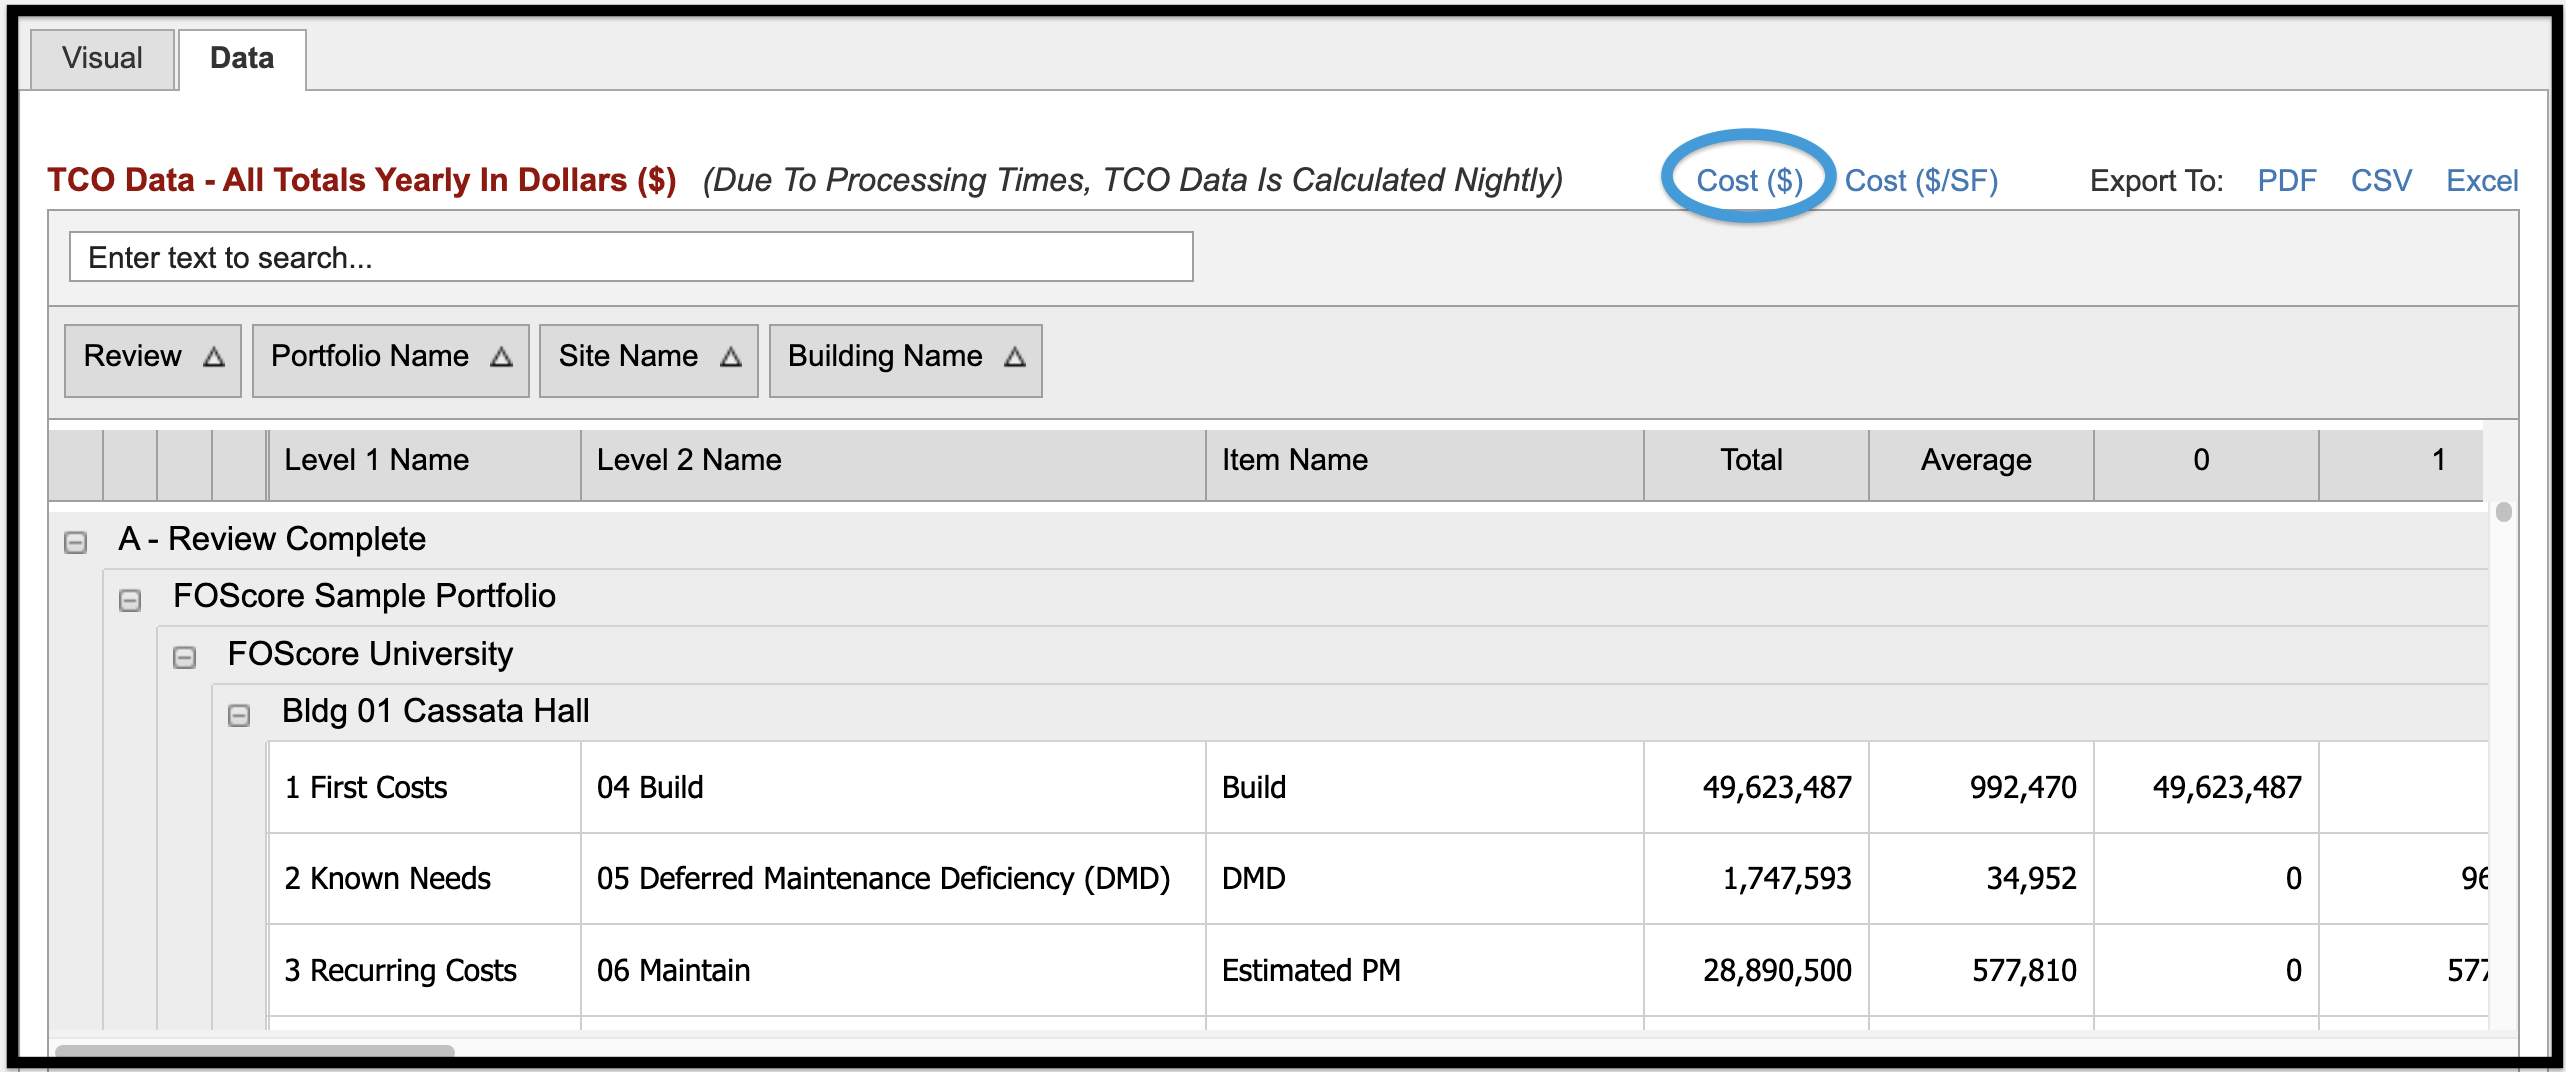
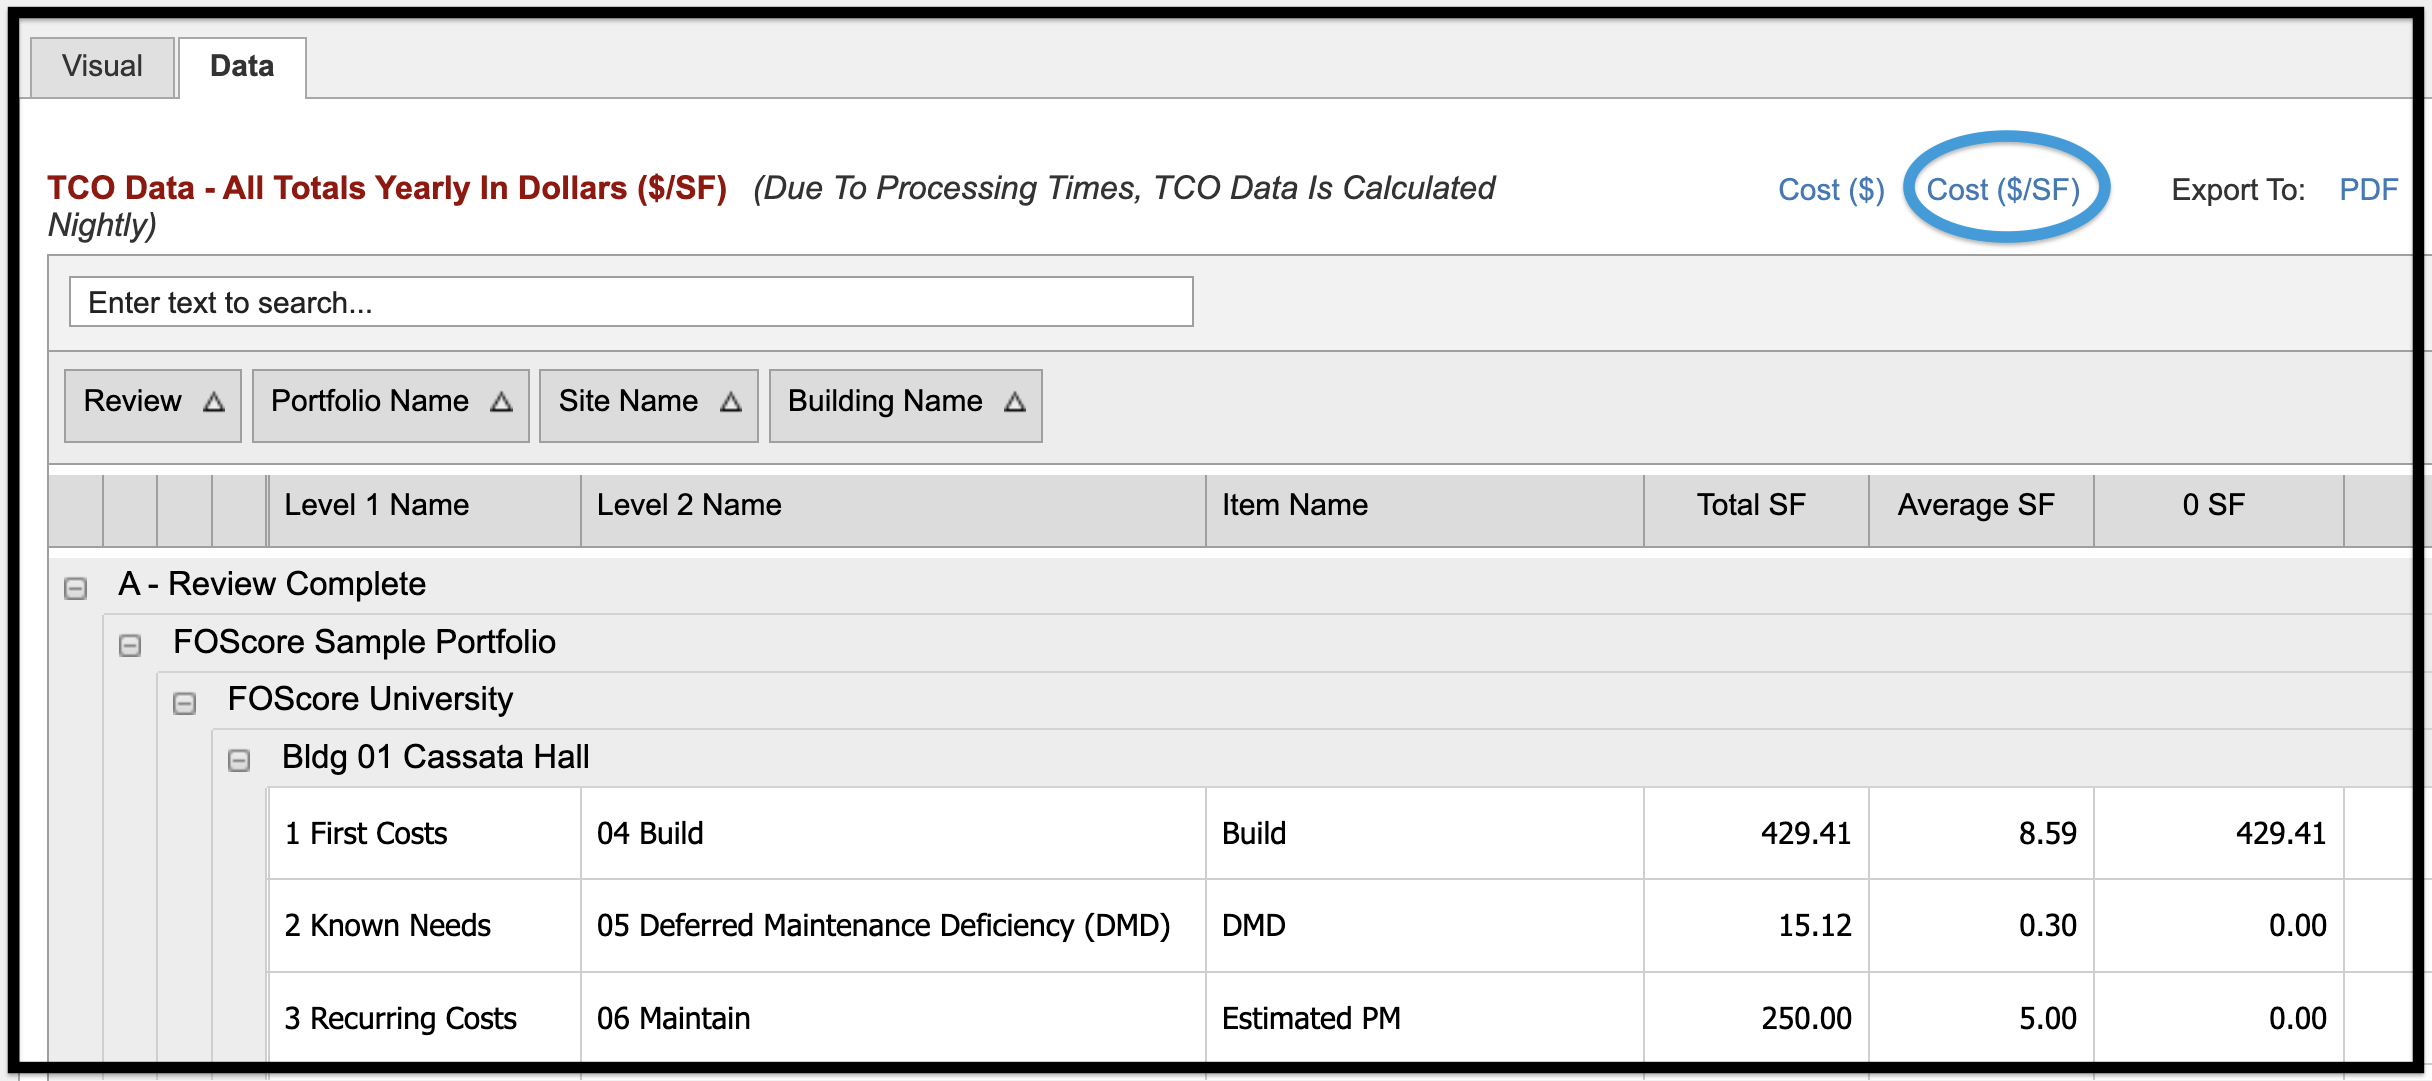
TCO Data can be displayed in two formats. In the upper right corner of the grid, click on Cost ($) to see all costs broken down by whole dollars. Click on Cost ($/SF) to see all costs broken down by $ per square foot.
Search #
Type a keyword in the Search field and records matching that description will be displayed.

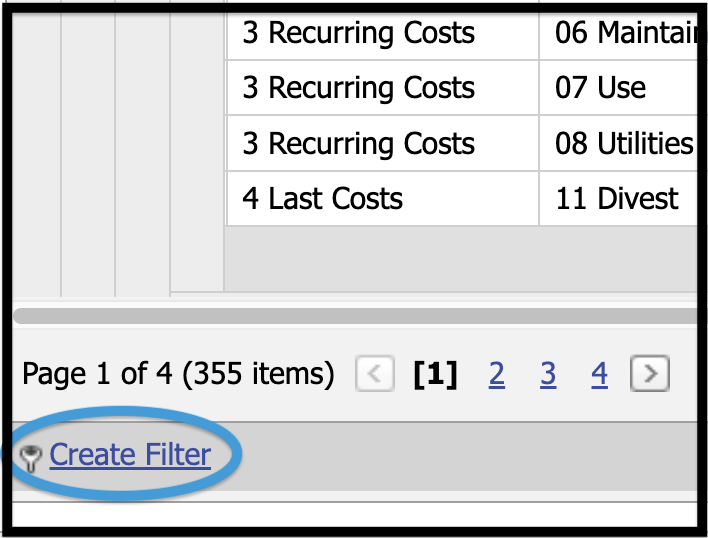
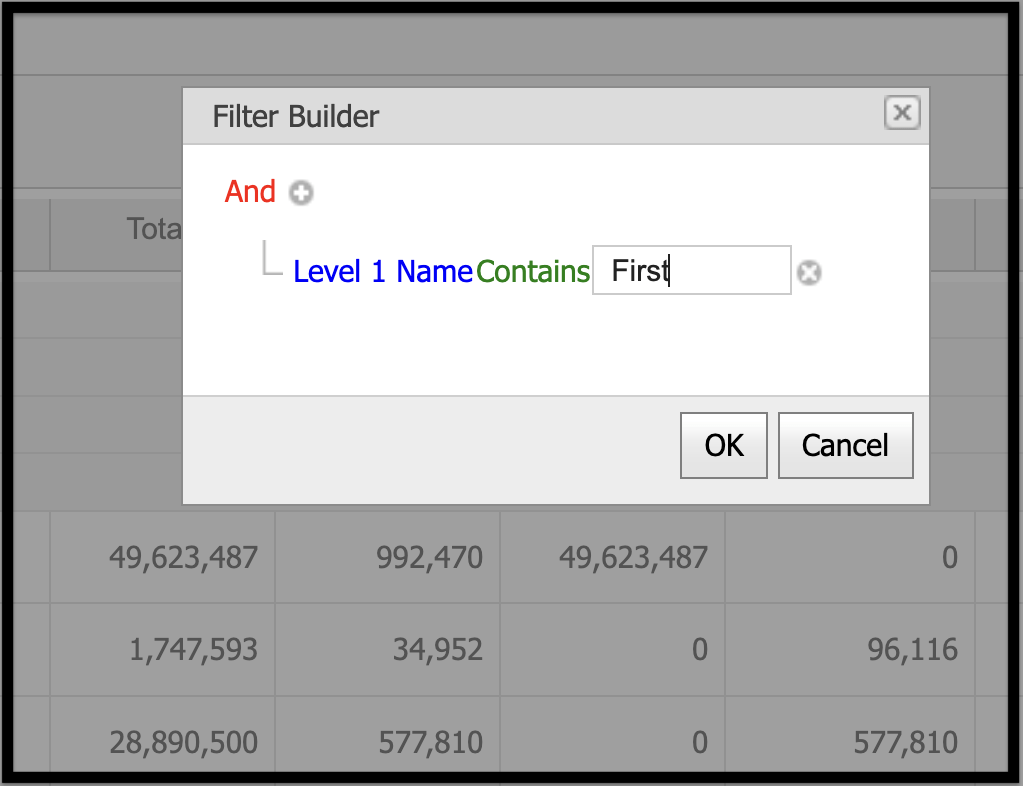
Create Filter #
In the lower-left corner of the grid, you will find an option to filter data.
Export #
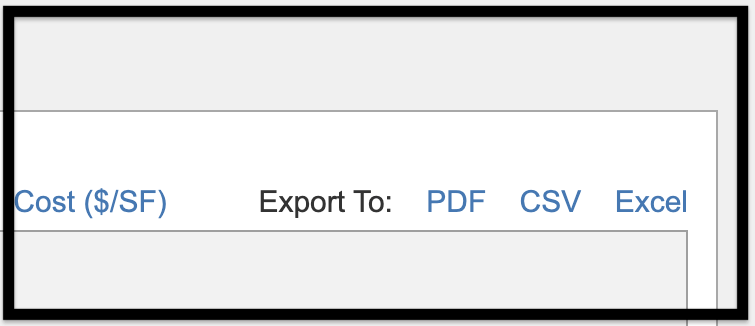
Three options exist for exporting data. PDF and Excel exports will yield results that are similar to what is displayed in the data grid, while CSV captures the data in a tabular format.
Client-Level Map #
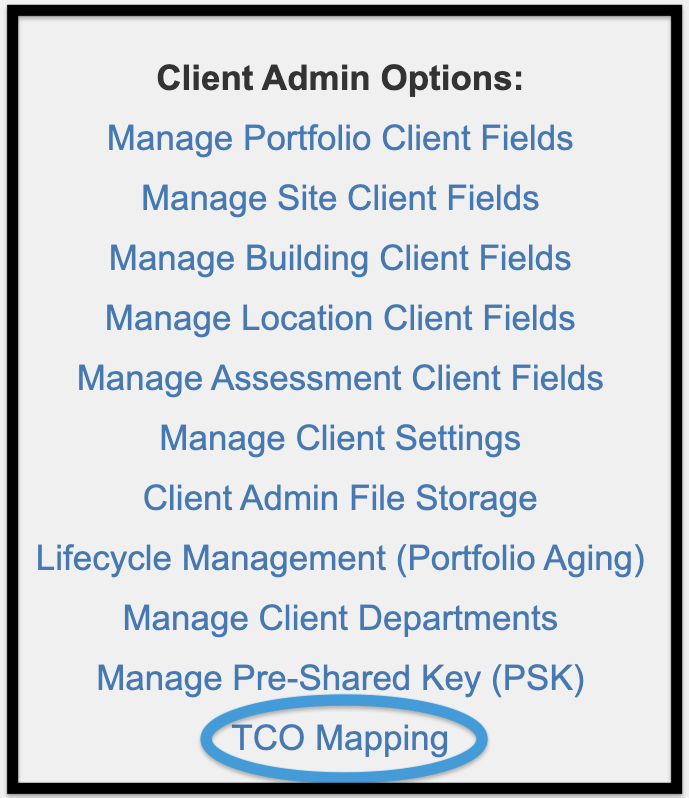
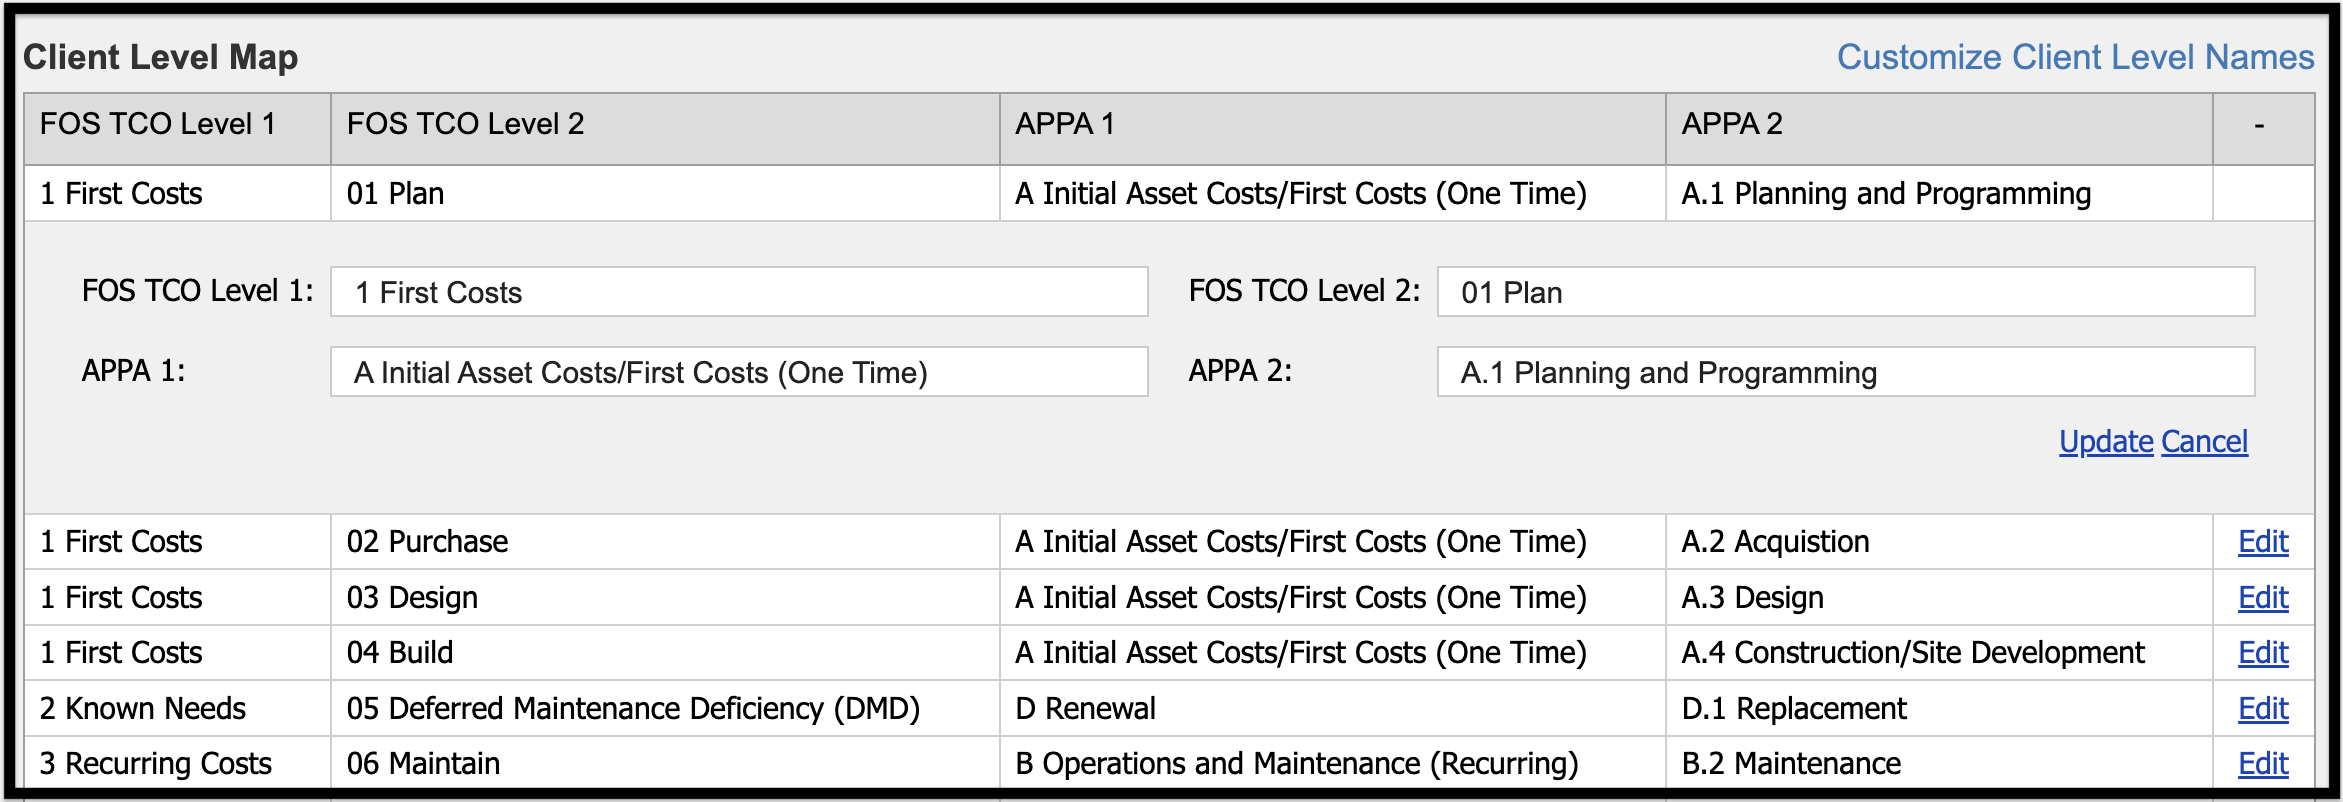
The option exists for the simplified FOScore® TCO structure to be mapped to a client-specific structure that can be available in the Ad Hoc Reports feature of the Reports Module. To access the Client-Level Map tab, go to the Admin Module of the software and click on the TCO Mapping link which is located in the Client Admin Options section.

You can customize names to fit your own unique needs, as shown below.
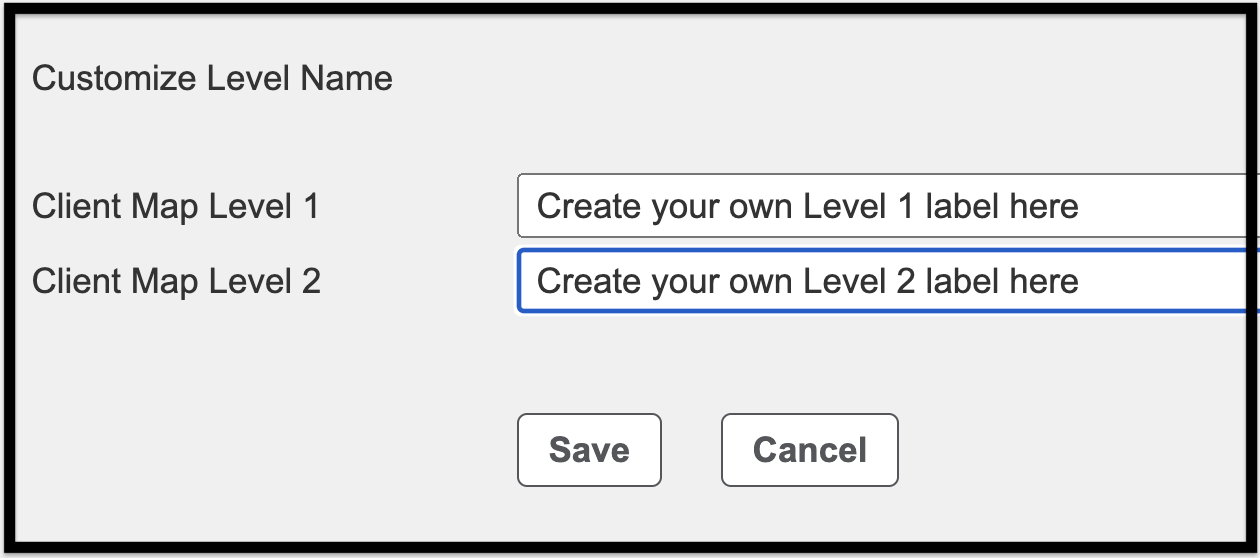
In addition, you are able to customize the labels that are used for mapping levels, as shown below.

© Copyright 2024, FOS of CannonDesign – All Rights Reserved – Confidential and Proprietary