
This site is a work in progress and will continue to change as our software evolves. Every effort will be made to publish updates promptly as they are released. Please email any questions or comments to pburgio@foscd.com.
Suitability #
Key Performance Indicators (KPI) #

In This Section #
- Introduction, What is Suitability (KPI)?
- Templates
- Creating a Template
- Creating Main Categories
- Creating Sub Categories
- Creating Line Item Measures
- Allowances
- Priority
- Additional Template Features
- Copy
- Grid
- Edit
- Assign
- Working With the KPI Template/Creating a KPI Template
- Edit the Scope
- Assess
- Template Data
- Customize Layout
- Review KPI Results
- Report
Introduction #
Suitability (KPI) Module #
The versatility of FOScore® has been enhanced with an agile Suitability Module (designated as KPI in site navigation). This module was created in response to our clients who need to collect, rank, compare, and score virtually any type of measurable data. The possibilities for measuring and quantifying within the tool are virtually infinite. The module goes well beyond non-FCA-related data collection into a useful tool built for analysis, planning, and the capability of blending varieties of normal and non-normalized data sets into custom result scores as well as stand-alone or blended result reports.
FOS® of CannonDesign is at the forefront of assessment methodologies that are rapidly evolving. With a 100% customizable Rubric Builder templating tool, the KPI Module can assist our clients in measuring how they are doing within the built environment relative to suitability standards, as well as virtually any other measurable or weighted standard; for example, educational adequacy, adaptability, visioning, operational adequacy or quality, and energy utilization.
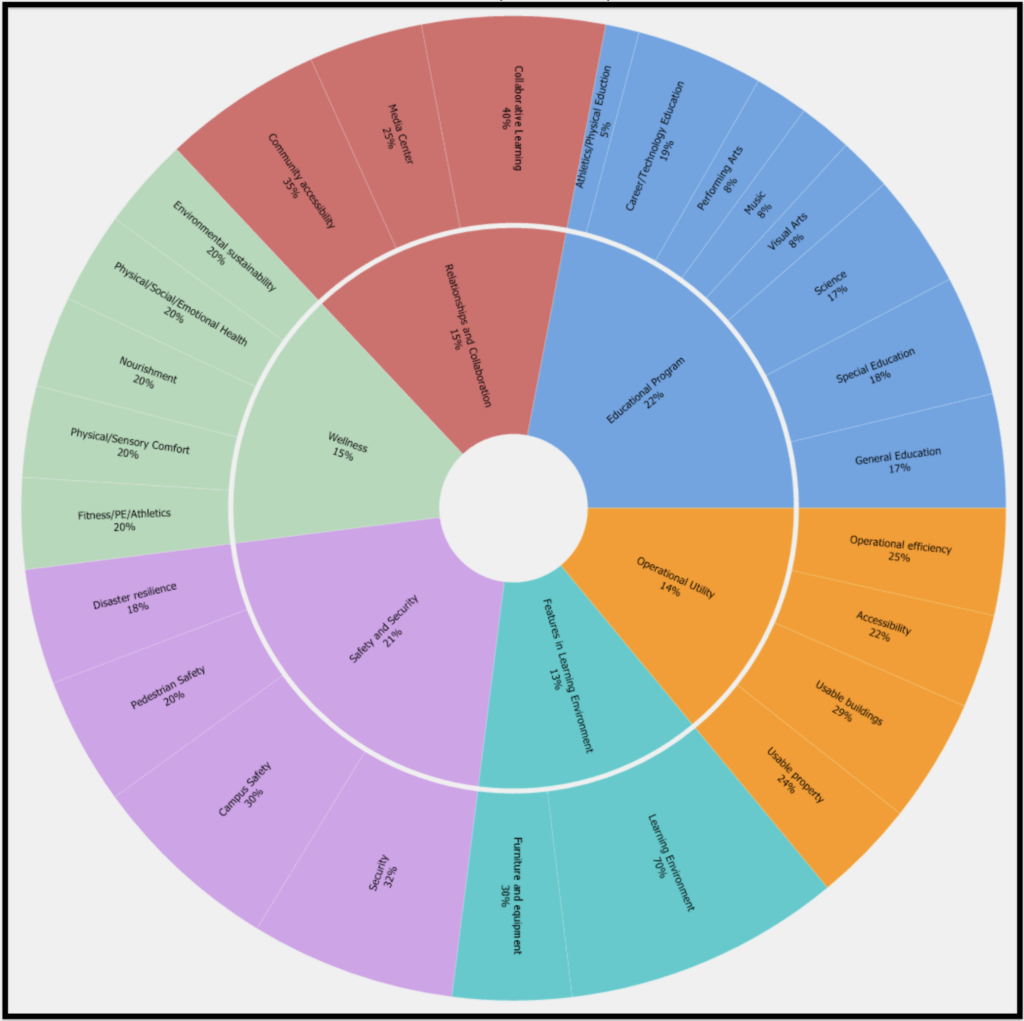
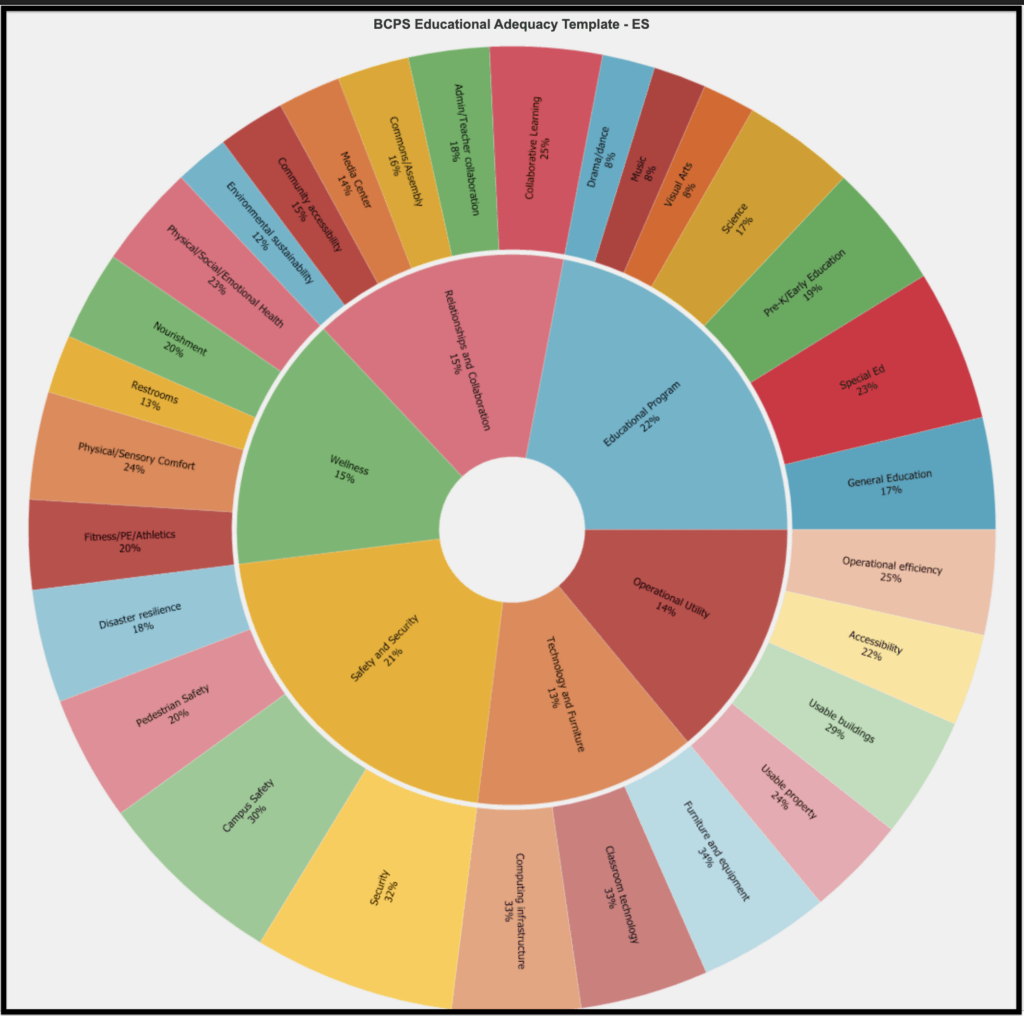
| Inner Wheel | Main Categories | The inner wheel of each template contains Main Categories and weights |
| Outer Wheel | Sub Categories | Each Main Category may have one or many Sub Categories. For example, the Academics Main Category may have several Sub Categories that determine what makes an ideal academics program |
| Metrics | Each Sub Category may have one or many metrics | The scores for each of these metrics would be tabulated, and weighted, and finally subject to the Sub Category and Main Category weight |
The software has the ability to apply these metrics at the Room, Floor, Building, Site, Portfolio, or Client level and the ability to apply different metrics depending on the room or space type; i.e.; you could ask different questions based on the type of room, lab versus instructional space. The more information collected in FOScore® the greater level of detail you are able to assign when creating your KPI assessments, however, it is also possible to perform a KPI assessment entirely at the Client level where no Portfolio/Building structure exists in the system.
Key Performance Indicators (KPI) #
Key Performance Indicators help drive informed decisions regarding facility and program needs for any industry or institution.
The flexibility of the KPI Module allows for virtually anything with a measurable property or attribute to be utilized for comparison within a weighted rubric. These rubrics can be saved within the system as templates for reuse or re-purposing over time as clarity emerges from the data. These data sets, and subsequent reports and data visualization tools, help compare and contrast the variety of benchmarks useful in assisting planners and decision makers to create actionable goals and objectives while building a longitudinal basis of reference.
The results can be utilized, for example, to:
- develop, measure, or inform suitability standards;
- provide insights into adaptability considerations for re-purposing based on the consolidation of programmatic, departmental, or human capital;
- score healthcare operational efficacy;
- provide a foundation for improvement plans such as:
- implementing new educational adequacy programs for PreK-12;
- higher ed visioning or recruitment strategies;
- enhancing healthcare standards, introducing new technologies;
- enabling the ability to focus on and improve energy conservation.
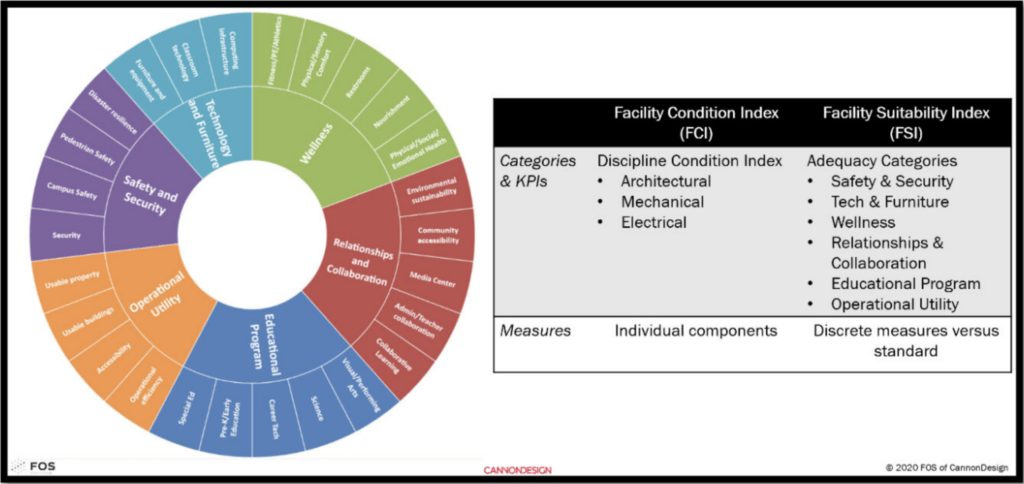
FCI + FSI = FQI #
Results are compiled in the FOScore® software system and can be ‘blended’ with facility assessment and facility management database data. When a Facility Condition Index (FCI) score for a particular building is blended with the same building’s Facility Suitability Index or FSI score a resultant Facility Quality Index or FQI is derived. This type of blending can be useful, for example, as a prioritization instrument for worst-first implementation. Further power is harnessed through additional modules within the FOScore® software to continue answering the “What is next?” question through our Estimating Module or our Capital Improvements tools for developing a multi-year planning and funding strategy reported along with foundational condition assessment deficiencies.
Templates #
Creating a New Template/Select a Template #
(FOScore® staff administrative function)
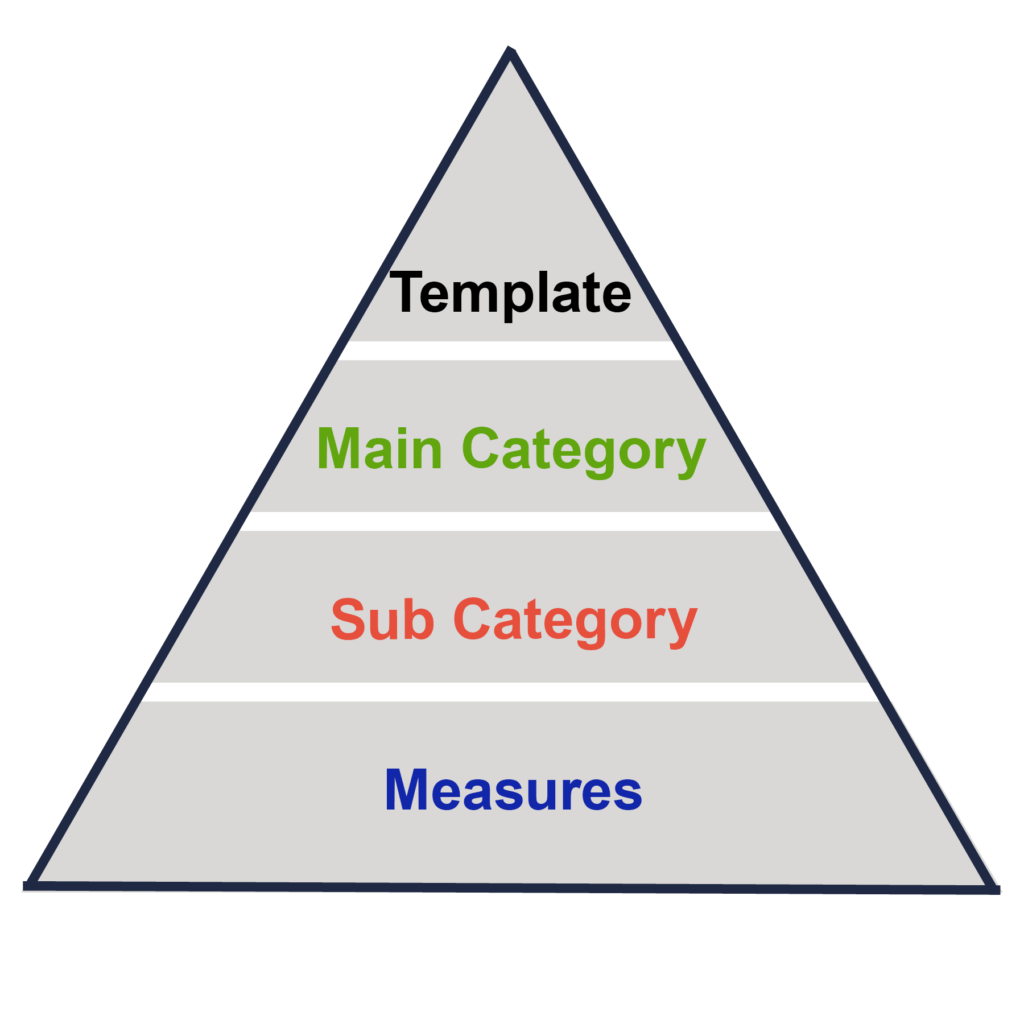
The structure of a KPI Module template consists of a hierarchical format (four-tiered) as illustrated below:
Creating a Template #
The following sections are developed and managed by a FOScore® administrator.
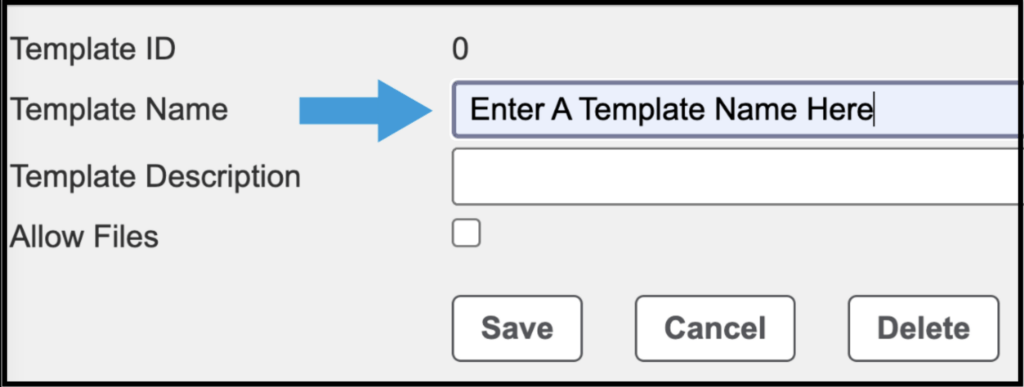
Many of these screens have already been populated for the user. When the user launches FOScore® and selects the KPI Module, they will be asked to select which template they wish to work in. When creating a new template (shown below) a template name and description must be assigned by the administrator/user.
Creating Main Categories #
Once inside the template, you have the option to create categories to measure, as shown below, click Create Main Category.

Each Main Category will be assigned a unique name and description and given a weight against all other Main Categories being measured. In the example below, the Main Category being assigned is Educational Program.
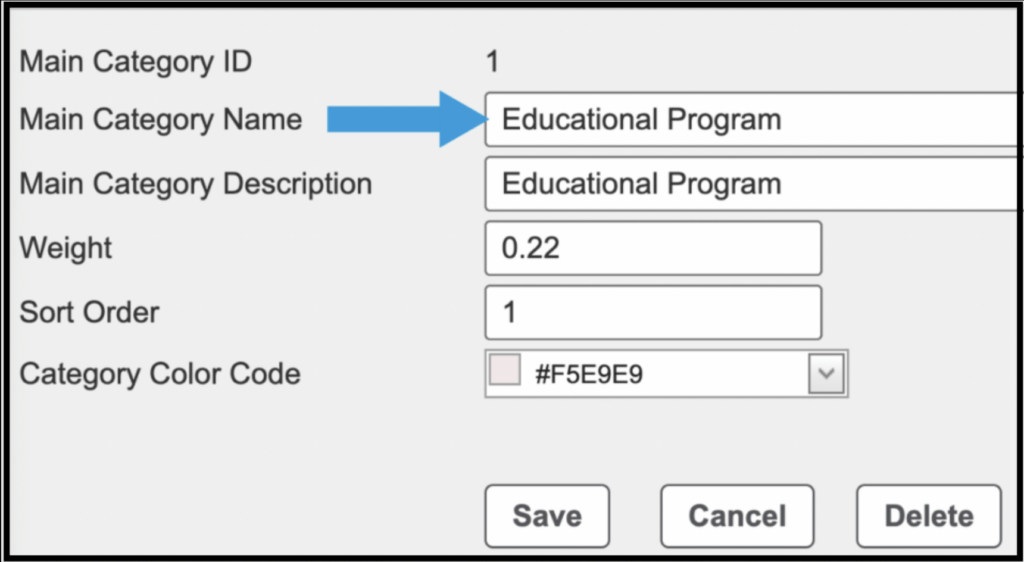
Once the category has been named, you would determine a relative weight to assign to that particular category in relation to all other categories being measured. The sum of weighting for all categories must equal 1.
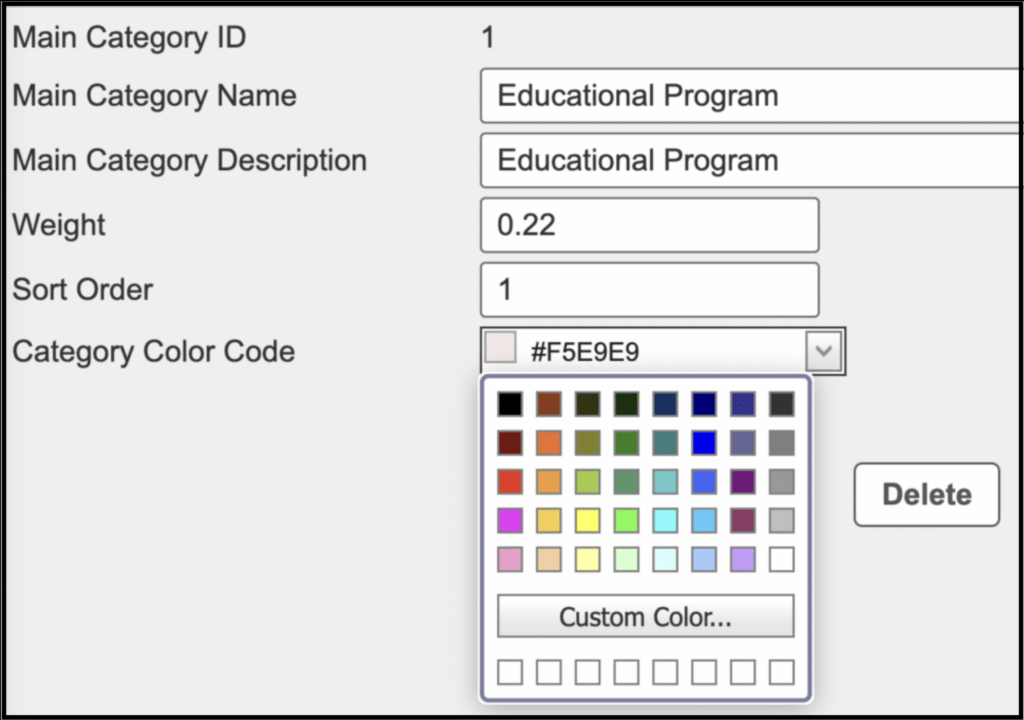
If relevant, a sort order can be assigned to individual categories. Additionally, for reporting purposes, each category should have its own color coding assigned to it.
Once each of the Main Categories has been established, with their relative weighting assigned, you will see a screen as depicted below. In this sample, there are six Main Categories being measured, with relative weighting: Educational Program, Relationships, and Collaboration, Wellness, etc. The weighing of each category does not need to be the same, but the sum must equal 1.

Creating Sub Categories #
The next level of inquiry in the KPI Module is Sub Categories. Sub Categories are weighed against one another to assign relative importance when undertaking an assessment or other study. As shown below, click on the Main Category of Technology to be taken to a screen in which Sub Categories can be created off the Main Category branch.

In the example below, Technology is being applied as a Sub Category of the Main Category. After the Sub Category Name, Sub Category Description, and Weight are assigned click the Save button to create additional Sub Categories. The sum of all weighting for Sub Categories must equal 1 or 100% within their respective Main Category.
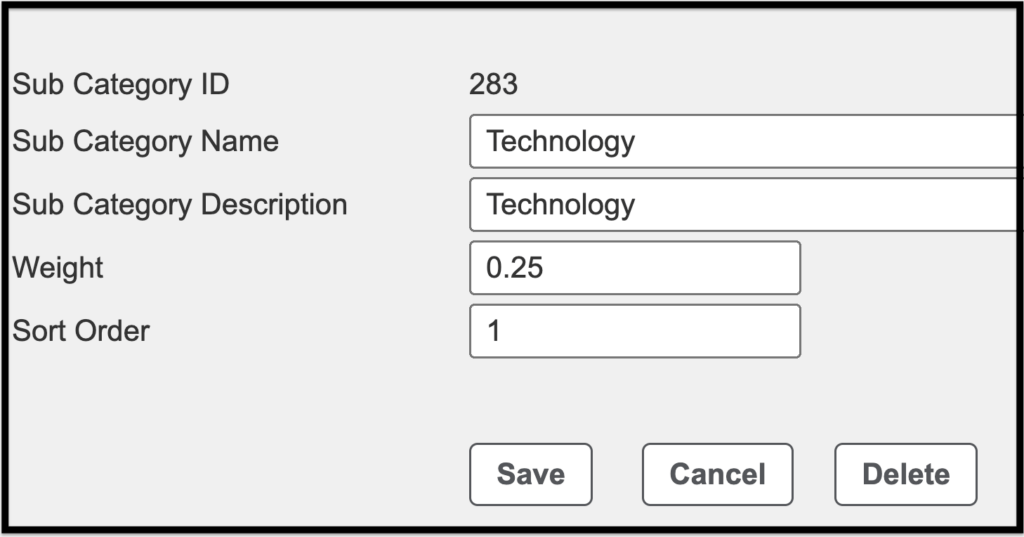
The image below shows three distinct Sub Categories that fall under the Main Category (as defined by their Measure Name and Measure Question). The relative weighting that has been assigned to each of the Sub Categories is also shown.

Repeat this process, as needed, to create as many Sub Categories of measurement as desired under a Main Category, while assigning their relative weighting. The resulting bucket of data will resemble the image depicted below; note that the sum of all Sub Categories weighting must equal 1 or 100%.

Creating Line-Item Measures #
Following the creation of Main Categories and Sub Categories, individual measures are then created. Line-Item Measures will ask questions that are relevant to each Main Category. Values will be assigned to assess this Line-Item Measure against all others.
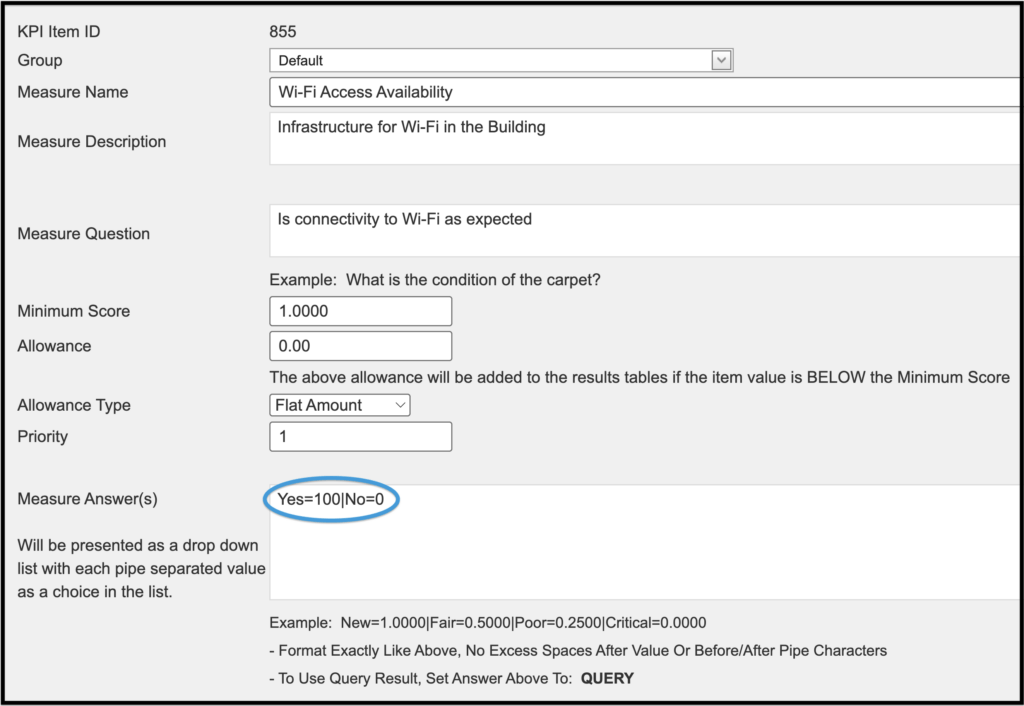
In the example below, the Measure Question ‘Describe the Wi-Fi within the building on a scale of 1 through 10 (10 being best)’ is being assessed. The Measure Name is ‘Wi-Fi Access’ and the Measure Description is ‘Wi-Fi Signal Strength.’ These labels will be used in data collection and reporting. They can be changed/reassigned in a different area of the KPI Module. The recommended Measure Answers should range from 0 to 100.
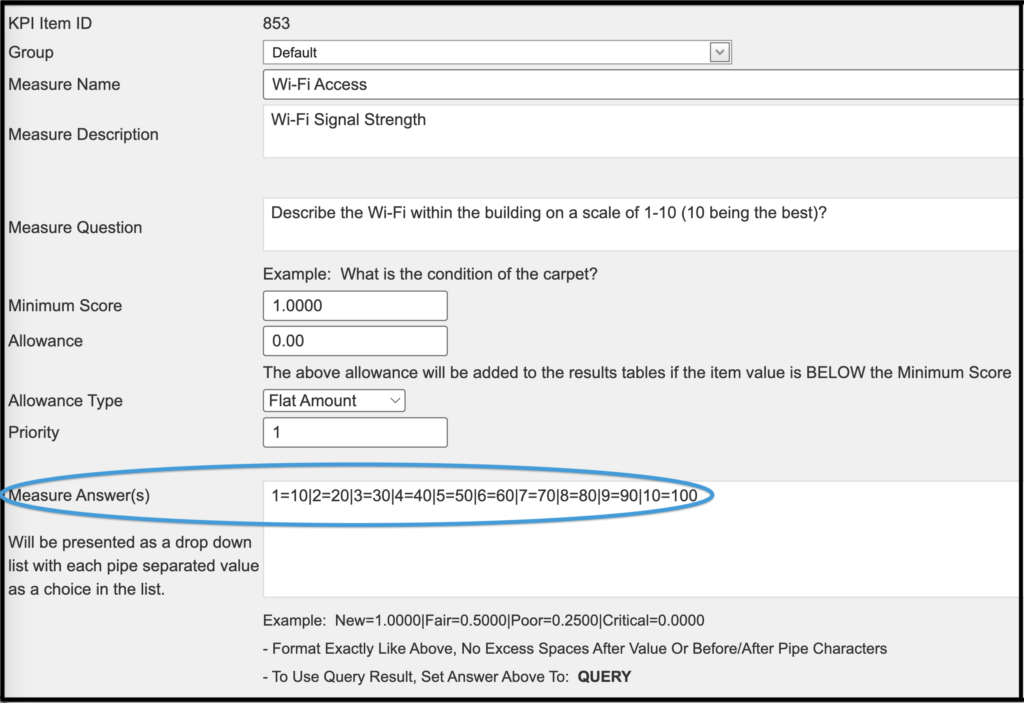
When asking a Yes/No question, the sum must equal 100; in this example with ‘Yes’ equaling 100 and ‘No’ equaling 0.
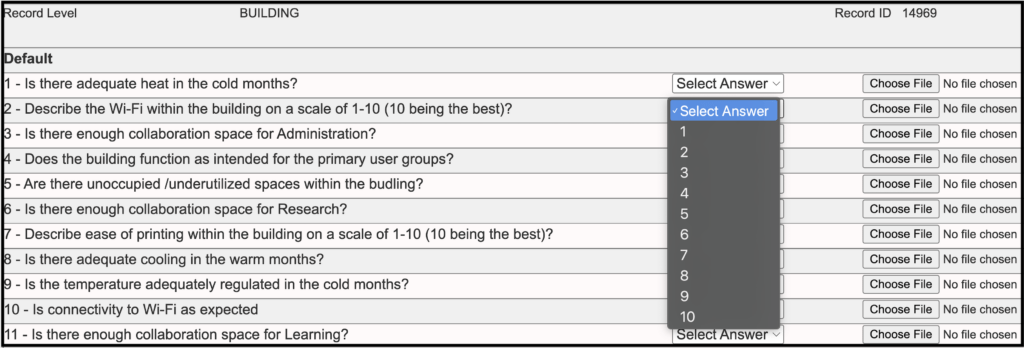
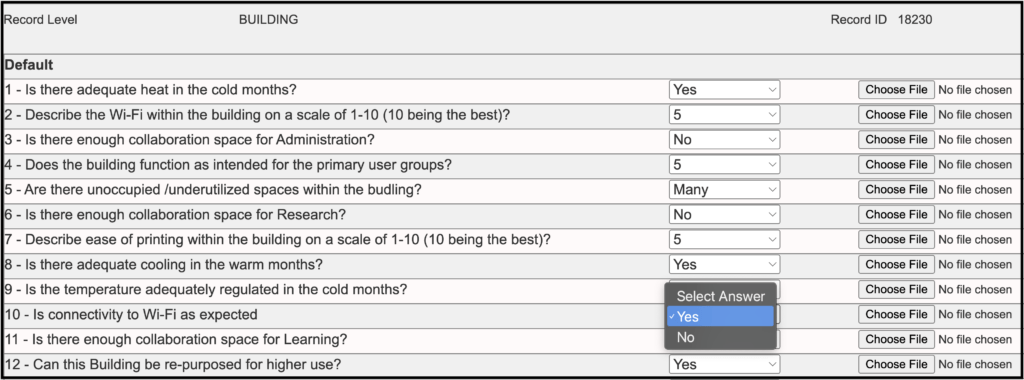
It is necessary to translate qualitative answer choices into quantitative results, for the purpose of calculating a score for each Measure on a scale of 0 through 100. The images below illustrate how, once the fields have been assigned, you can determine a weighted value for the condition of what is being assessed. In the first example, the scale of 1 to 10 is represented based on the Measure Answer(s) that were entered above; while in the next example, a Yes/No choice appears, in which ‘Yes’ was assigned a value of 100 and ‘No’ a value of 0 in the Measure Answers field. Additionally, there is an option to upload documents and/or photos that correspond with the Measure Question.
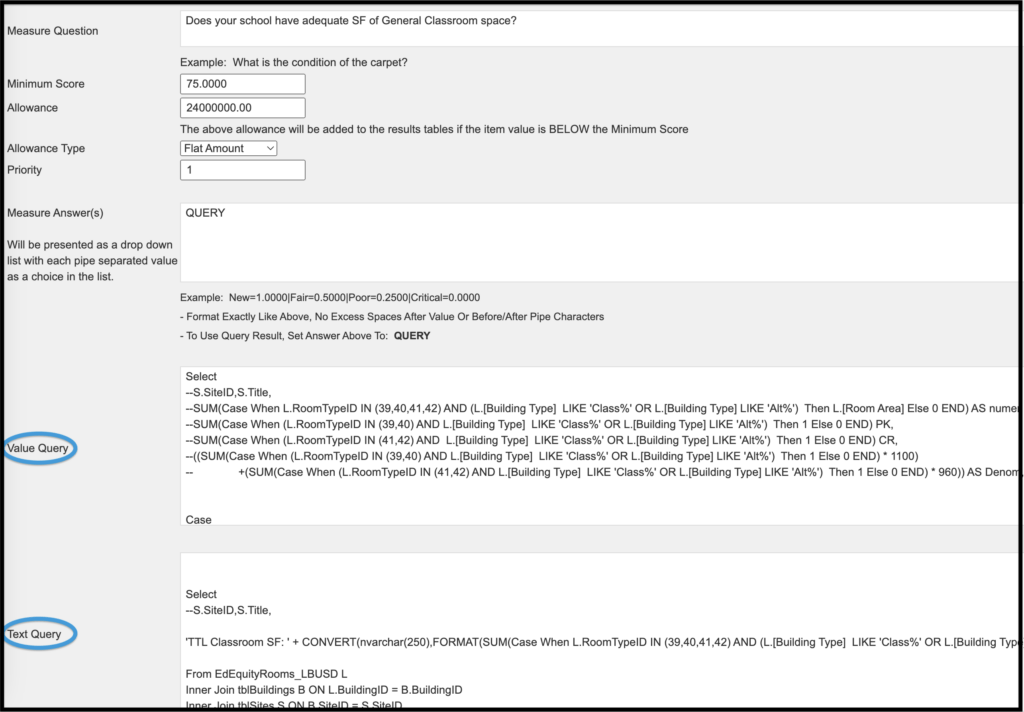
Each KPI Measure can be given its own weighting to be balanced against its relative value to all KPIs that are being measured. Two additional fields, shown below: ‘Value Query’ and ‘Text Query,’ are built into the KPI Module for additional data collection and study. Depending upon the nature of the query, and the potential for gathering information from multiple datasets, you would be working with a FOScore® representative to create and customize these queries.
Finally, determine at what level the data is to be collected. Measures may be assigned to any hierarchical level that corresponds to the structure under the main Assets Module in FOScore®. The available options to assign a Measure are Client / Portfolio / Site / Building / Floor / Room. In this example, Room level is selected, and a drop-down menu provides options for which areas of the building would be assessed–whether classrooms, laboratories, or commons areas–depending on the nature and purpose of the query. Default score values can also be assigned if the measure is intentionally hidden due to the Room Type not existing within a building.
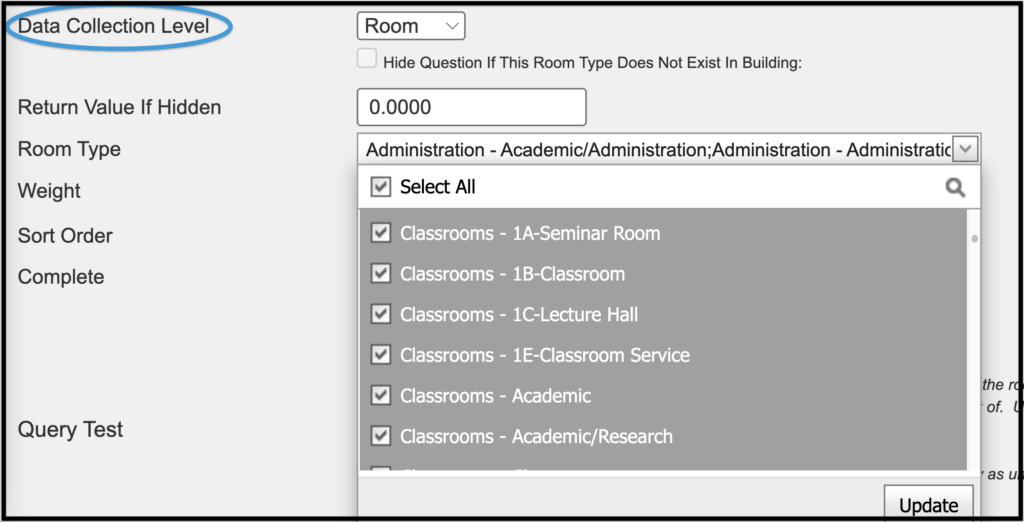
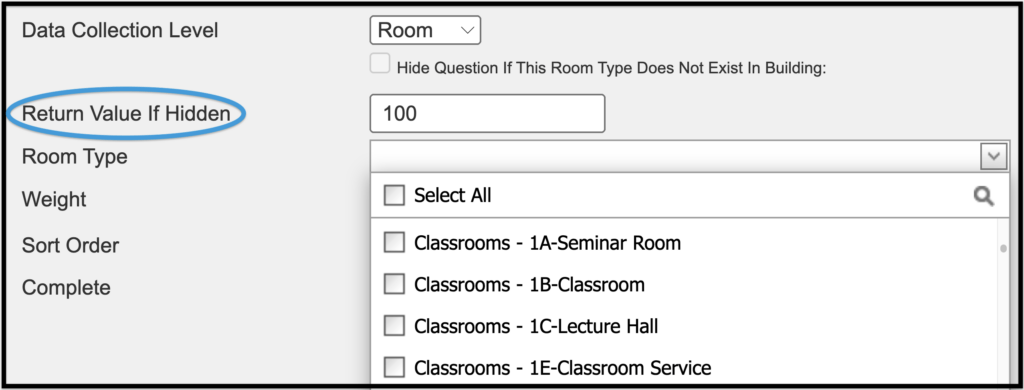
In completing the Weight option in this section, the sum of all weightings must be equal to 1.
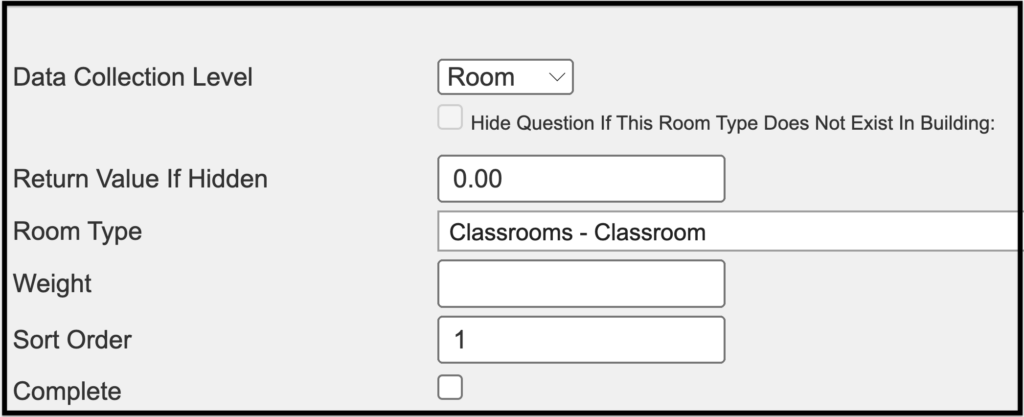
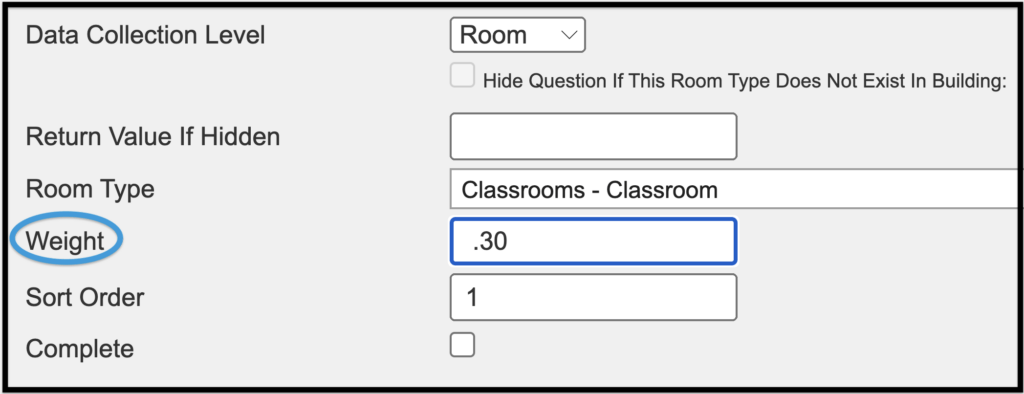
Variables are given significance in relation to others by the portion of the sum of 1 that they are assigned. In this example, a value of .30 was assigned.
Once all Measures are created, you will see the full list of Measures within the respective Sub Category. Again, you will need to ensure that the sum of all Measures is equal to 1 or 100%.

Allowances #
For the purposes of refining the reliability and functionality of Measures, you have the ability to assign an Allowance to a respective Measure. Two types of allowances are available. The first is a flat-rate, or lump sum allowance, the second is an allowance that is assigned per building square foot (BGSF).
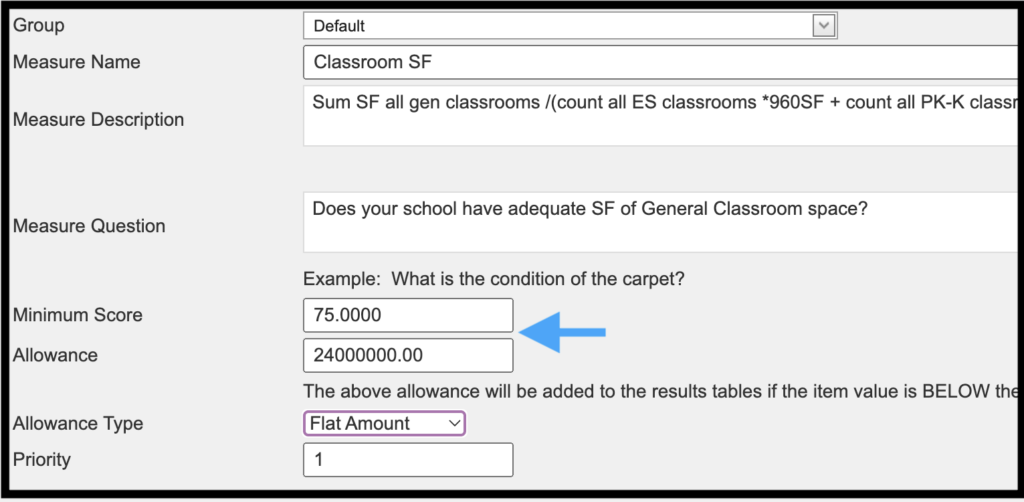
Within the drop-down menu, assign a minimum score that the Measure must meet. An Allowance is assigned for every instance in which the minimum score is not met. For example, once a building has been assigned to a template, and the building is under assessment, every time a given Measure fails the assessment, the Allowance would get applied. In the examples below, a school is being assessed and the question is being measured at the Site level.
In the first view, when the minimum square footage for a classroom is not met, a lump sum Allowance is applied, (e.g., for new construction or an addition).
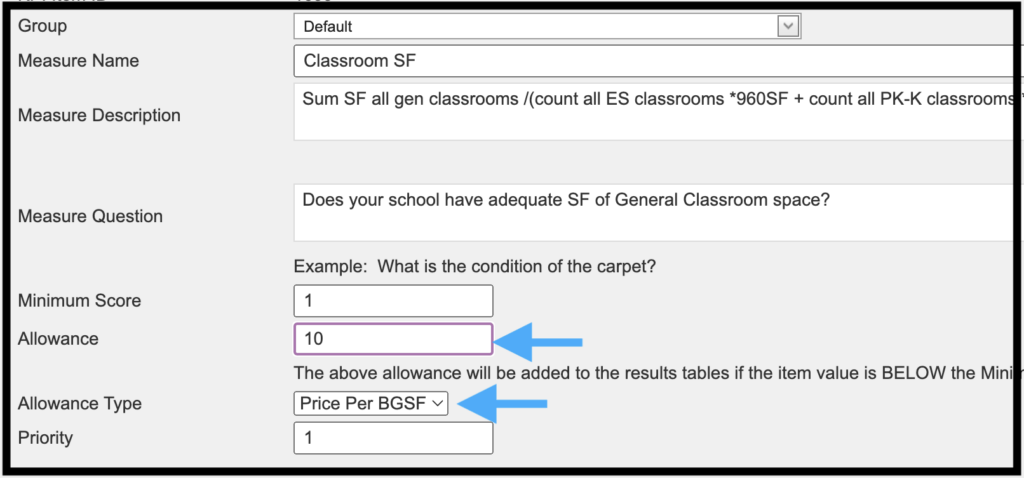
In the next example, when the Measure falls short, a cost per building square foot or square foot (BGSF) is applied. For example, each time the Measure is not met, an Allowance of $10 per square foot would be populated to all buildings within the scope that this Measure has been applied; or BGSF x Allowance = Sum.
The benefit of the Allowance feature is that any item that does not meet the minimum score triggers an Allowance. A FOScore® support team member will work with you to assign an applicable Allowance. Some examples are Measures that don’t get a perfect score of 100; anything that scores 50 or below; anything that has a 0 assigned to it (in which case the Measure would have to fail completely in order to get an Allowance). Allowances can be assigned on a case-by-case basis and are intended to be flexible.
Priority #
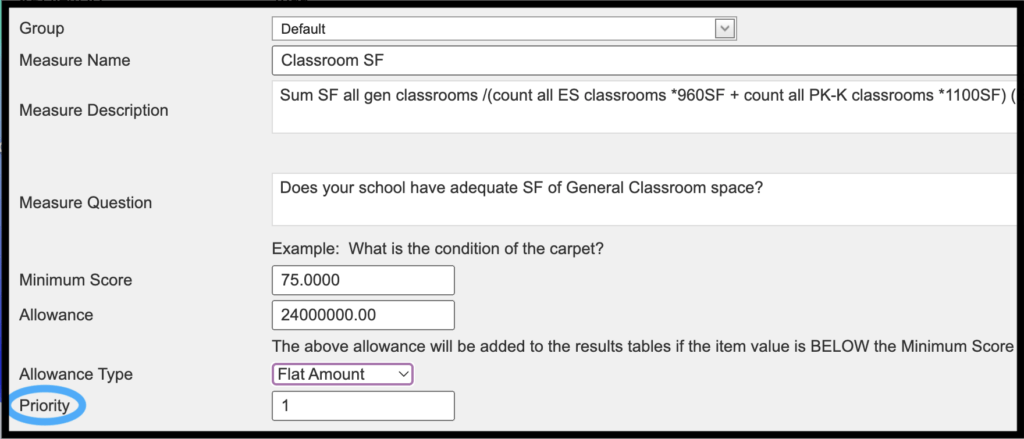
Priority gives you the option of assigning a preferred range of ratings to further enhance the data.
Priority is user-defined and can be anything from 1 to 5, 1 to 10, or any desired scale, further giving you the opportunity to identify what needs to be pushed to the top of the list. The Priority tool is so customizable, for example, 10 can be given the highest priority, versus 1.
Additional Template Features #
At the template level, there are four features that will enable you to view reports, manipulate weightings, and have other global editing rights, as well as export data into comprehensive spreadsheets and charts. These features are Copy, Edit, Grid, and, Assign.

Copy #

The Copy feature enables you to replicate an entire template, which includes Main and Sub Categories, line item measures with their weightings, and other properties of an existing query. After renaming the new template, you have the option of changing only those items that vary from one asset or item being assessed to the next.
Grid #

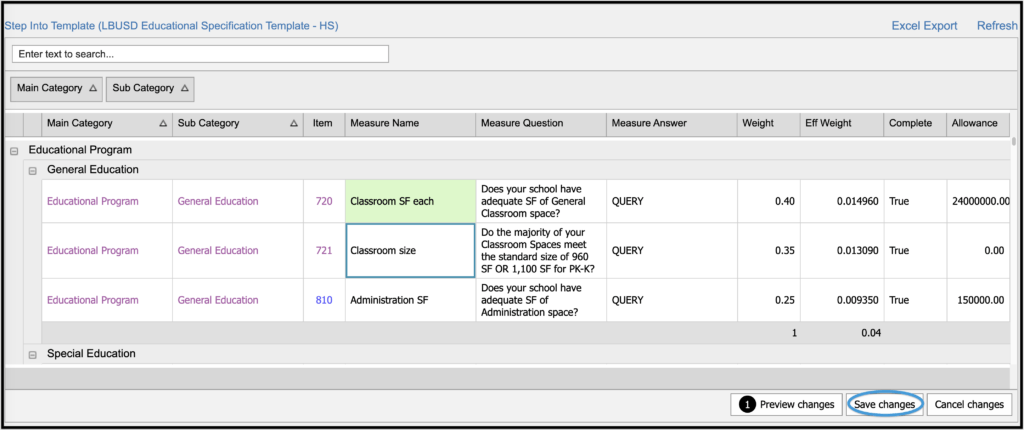
Selecting the Grid feature allows you to see the entire rubric that has been captured with the KPI Module. All measures are populated. Sorting and grouping are available as features. You can make changes in the grid, such as naming or weighting of categories without having to go back out to the original building/asset to do so. Editing is simplified in the grid view. Changes are highlighted in green and you have the option of previewing all changes before saving changes.

Edit #

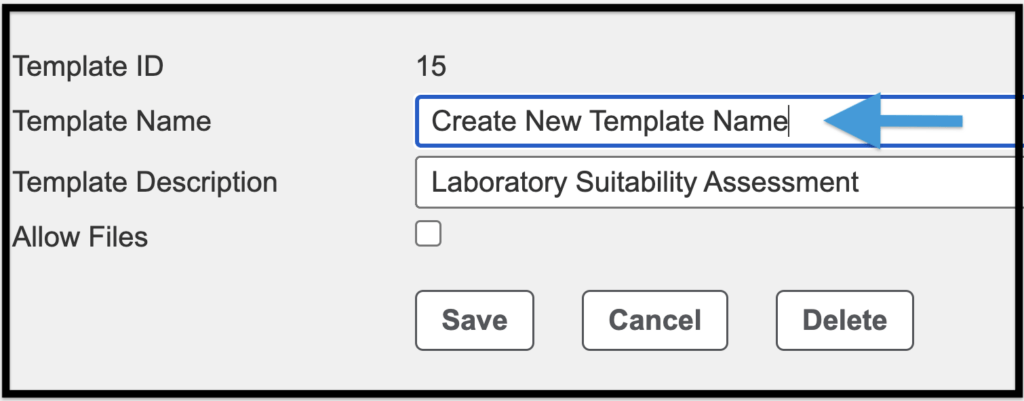
The purpose of the Edit feature is to give you the ability to change an existing template name or description. Select the check box to allow an image file to be imported for each line-item measure.

Assign #
Assign is primarily an Admin-level function that enables the user to assign a template to a client.
Working With the KPI Template – Completing a KPI Assessment #
Edit the Scope #
To utilize the full functionality of the KPI module, once the template has been developed, select the Edit Scope link on the right side of the Assessment Description to assign a template to a building.

Select a Portfolio, Site, and Building Type in the series of drop-down menus as shown below.
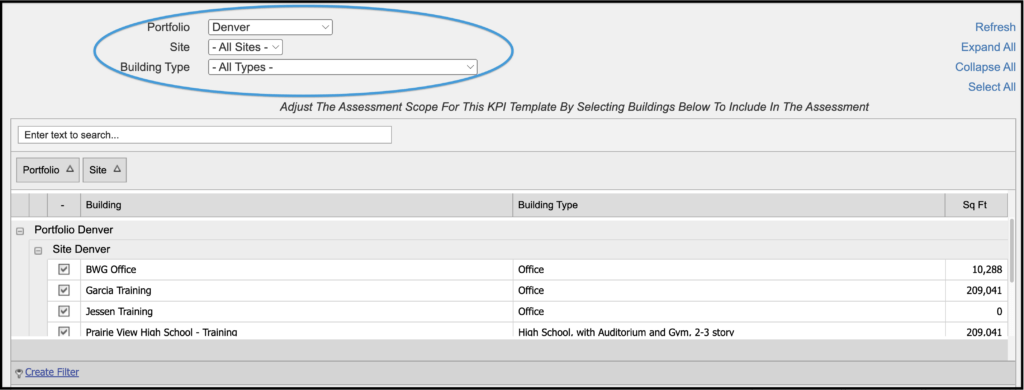
Select All is an additional option, but would probably not be used for most KPI queries.

Once the Portfolio, Site, and Building type have been selected, the KPI module will be populated with all relevant buildings. Use the checkboxes on the left to select which buildings are to be assessed.
Assess #


For illustrating the module, the Bergstrom Training Building has been selected for the KPI Assessment.

Once you have clicked on the Assess button from Bergstrom Training, you will see the data collection progress displayed with the total number of questions (line-item measures) that have been completed, along with the total ‘Percent Complete.’

This is how the questions that were created using the template would appear:

During the Assessment, you have the ability to take and upload a photo from a mobile device or select one from a directory (as shown above). Y0u then have the option to save the questions and mark them complete; cancel, if a revision is needed; or save and leave open if all questions are not being completed at the same time.

Click on the Refresh button on the upper right. The information will be updated at the Building level as well as the Portfolio level. When working on a large number of assessments, the ability to hide completed assessments is a helpful feature.

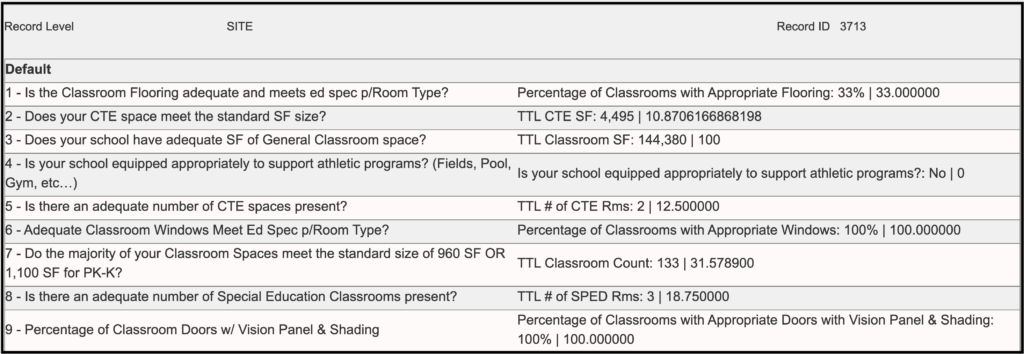
This is what a more comprehensive KPI Assessment screen would look like:
Template Data #
Back at the template main screen, click on Data to go to the area of the KPI Module in which all raw scores of the weighted measures can be viewed.

In the upper right corner of the screen shown below, you will note the ability to export the data to Excel for additional functionality; the second image provides an example of what the export would look like in Excel.


Customize Layout #
In the upper right corner of the KPI Assessment Data grid, you will find the Customize Layout option. Click this option if you would like to modify the look of the database viewer by changing what items you see, and how they are sorted and grouped, in addition to other options.

The image below shows some of the options available in the Sorting tab of the Customize Layout feature.
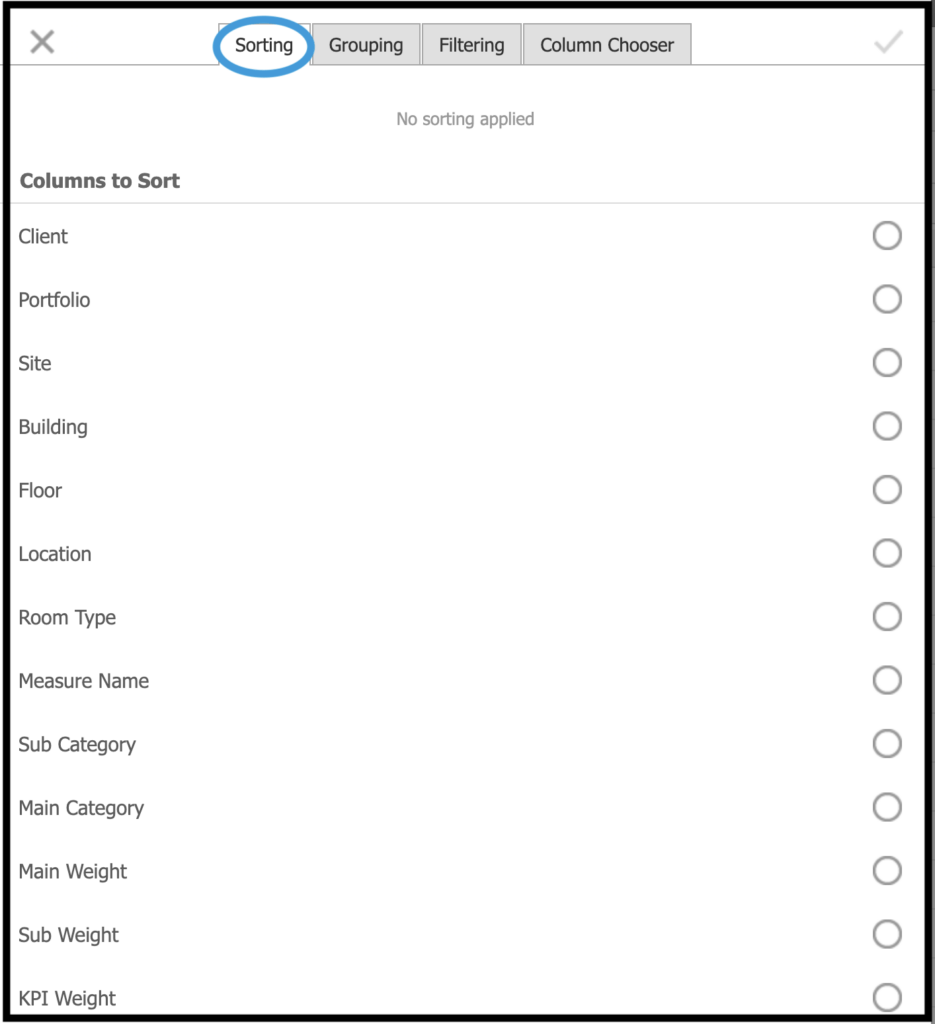
Within the Customize Layout feature, there are four available tabs:
- Sorting
- Grouping
- Filtering
- Column Chooser
Each tab allows you to apply the named function on many of the fields within the KPI Assessment Data grid. Click on the circle to the right of the fields you would like to include in the grid view.
The following fields are available for selection:
| Client | Portfolio | Site |
| Building | Floor | Location |
| Room Type | Measure Name | Sub Category |
| Main Category | Main Weight | Sub Weight |
| KPI Weight | Eff Weight | Text |
| Raw Score | Eff Score | Level |
| Collection ID | Allowance | Priority |
| Ref Text | Ref Decimal |
Review KPI Results #
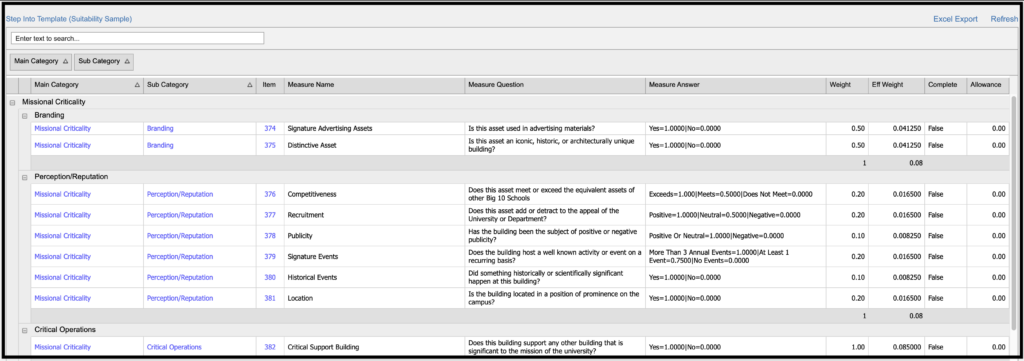
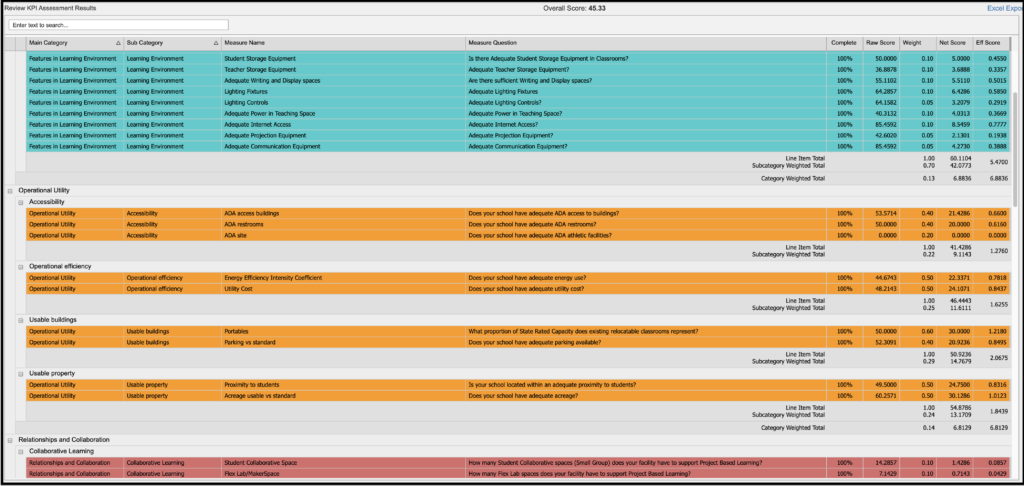
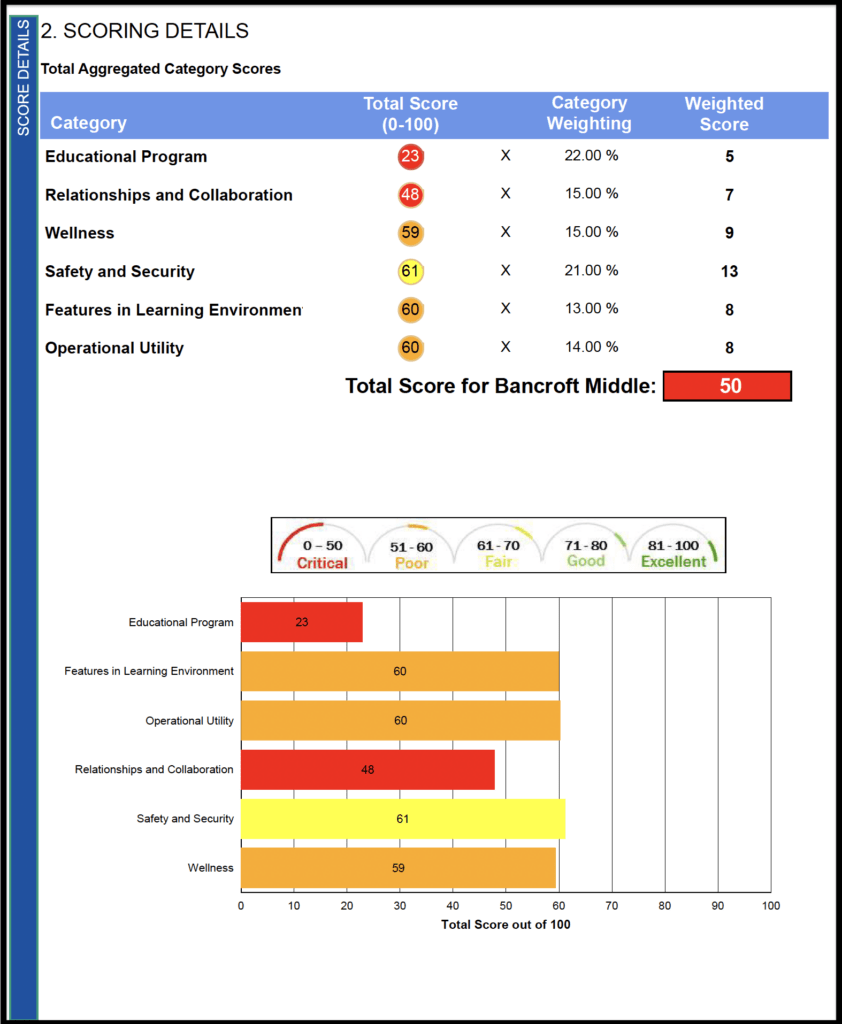
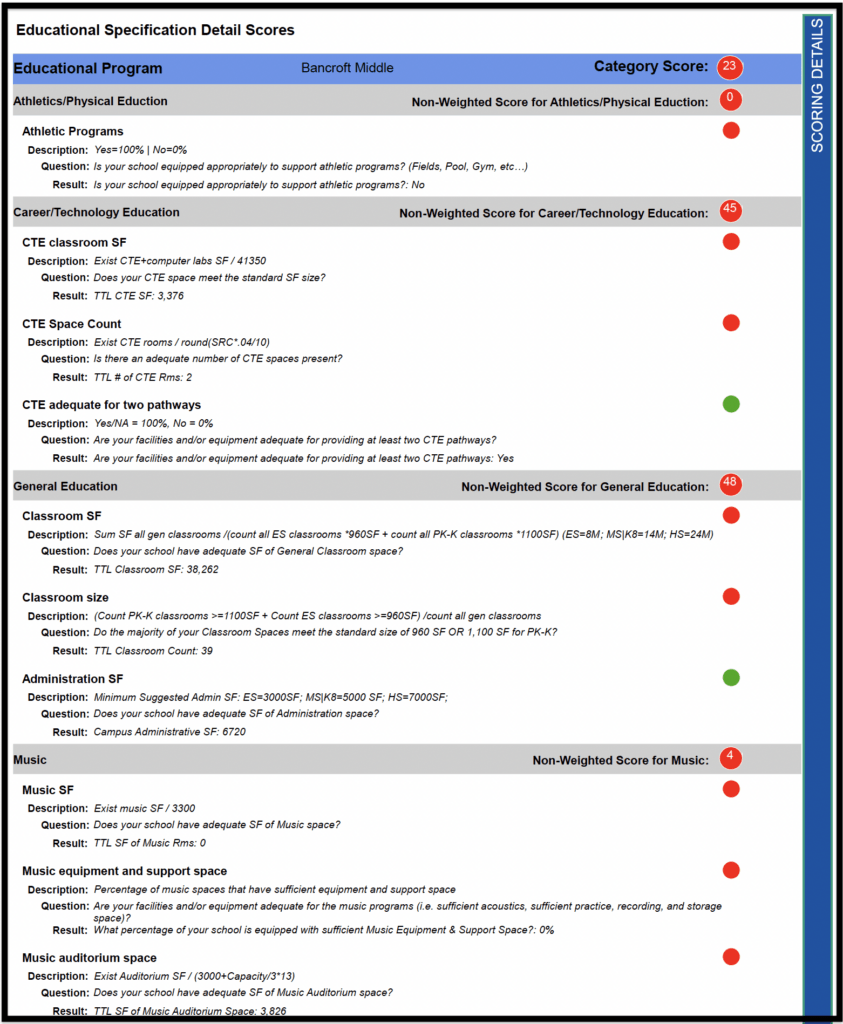
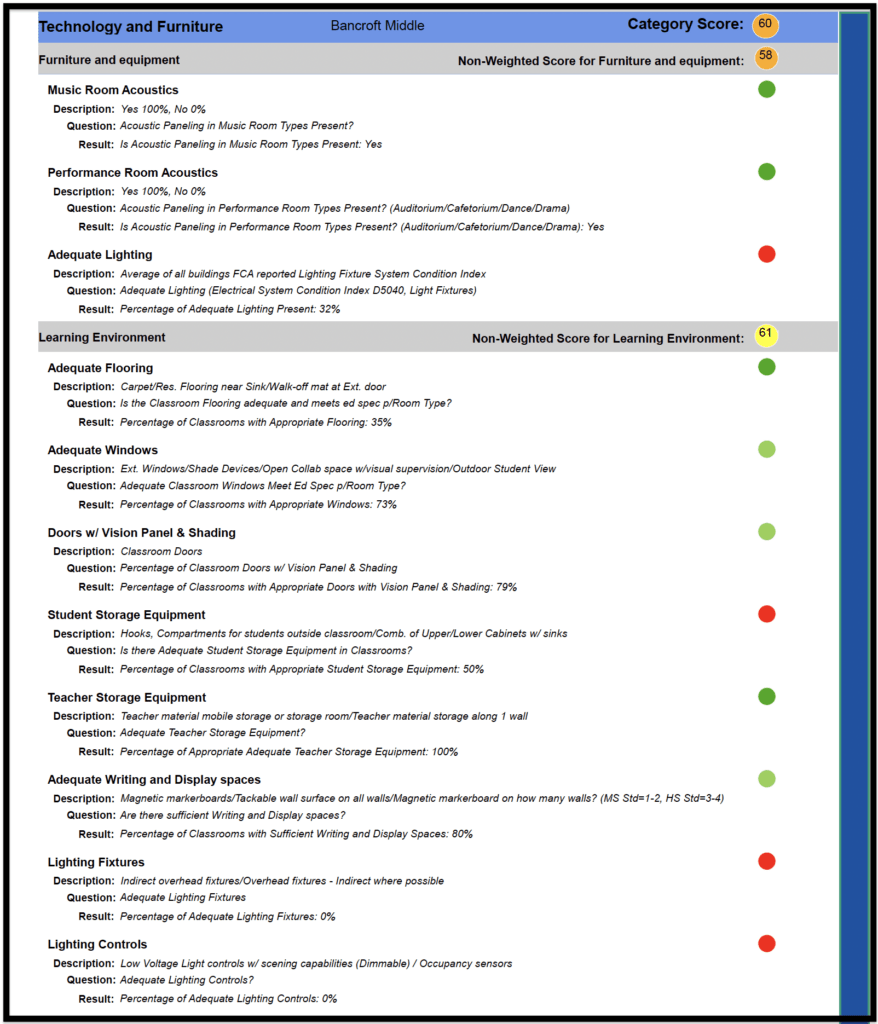
This feature allows users to view all aggregated results/scores of the entire template after (or anytime during) the assessment. There is a column for ‘Complete’ to allow for the real-time status of all measures that are assigned within the scope.
Back at the template main screen, the option to click on ‘Results’ will take the user to an area of the KPI module in which all raw scores of the weighted measures can be viewed.

For the purpose of adding context for the need to create Main and Sub Categories, Measure Name, Measure Question, and assigning a weight to the individual variables, a preview of one report screen is shown below, known as ‘Review KPI Assessment Results.’ The feature of an Excel export is also built into this screen.
Reports #
© Copyright 2024, FOS of CannonDesign – All Rights Reserved – Confidential and Proprietary